
Moderation in Higher-Order SEM: Interactions, Scores or Group Comparisons
A higher-order construct may relate to an outcome differently under different working conditions. The challenge is to preserve the intended construct when adding an interaction or comparing groups. Original AMOS/SmartPLS figures illustrate the decisions that need explicit justification.
Higher-order specification concerns measurement; moderation concerns a structural relationship. Saving scores does not automatically resolve measurement error. Splitting a quantitative score into groups also changes the research question.
1. Specify the higher-order construct before adding moderation
Let H denote the higher-order construct, L₁, L₂, … its lower-order components, M the moderator and Y the outcome. Decide whether H explains the components or is formed by them. This determines specification, measurement assessment and score construction; a two-level diagram alone cannot justify the choice (SmartPLS, n.d.-a).
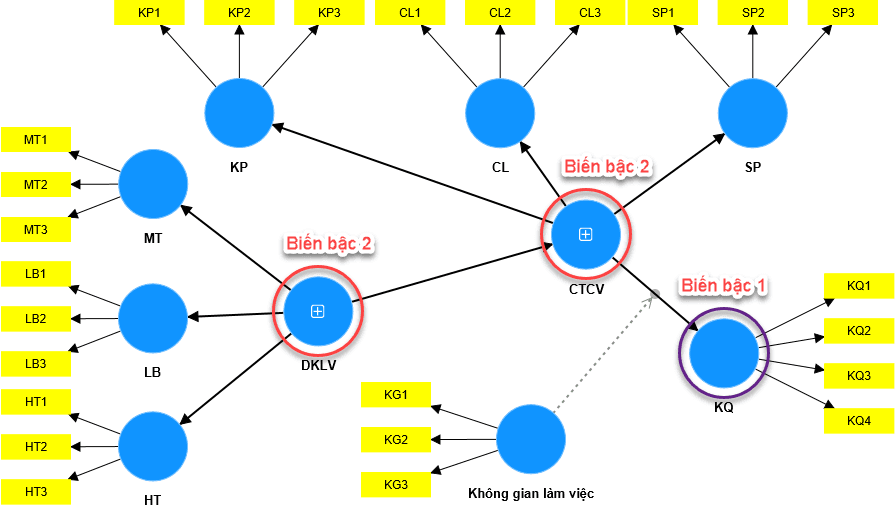
Name the specific moderated relationship, such as H → Y varying with M. If individual components also predict Y, their effects and the effect of H are not interchangeable claims. Theory and identification should guide the specification before estimation is selected.
2. Three strategies answer different questions
| Strategy | Analytical target | Limit to report |
|---|---|---|
| Interaction within a latent model | Retain measurement and specify a suitable latent interaction. | Identification, method and software support require justification; higher-order complexity is not resolved by one product variable. |
| Score-based analysis | Use representatives of H and M obtained under a stated scoring procedure. | Estimates concern estimated scores; consider measurement error and first-stage uncertainty. |
| Multigroup analysis | Compare paths across groups meaningful in the research design. | Comparable measurement and a test of the actual constrained path or path set are required. |
There is no rule that higher-order models must use MGA. With a quantitative moderator, an interaction can address how the slope varies with M directly (Hayes, 2022). MGA is a strategy for a group hypothesis, not a default workaround for difficult interactions.
Distinguish the application from the estimation framework. SmartPLS includes both PLS-SEM and CB-SEM capabilities. Diagrams with the same variable names need not represent the same statistical model. Identify the estimator and measurement specification for every analysis.
3. Two different tasks are called two-stage
For higher-order PLS-SEM measurement, a two-stage approach can use lower-order results to represent the higher-order construct. For moderation, a two-stage approach constructs an interaction from appropriate scores. State which scores came from which model and how they enter the subsequent analysis; the tasks have different purposes (SmartPLS, n.d.-a, n.d.-c).
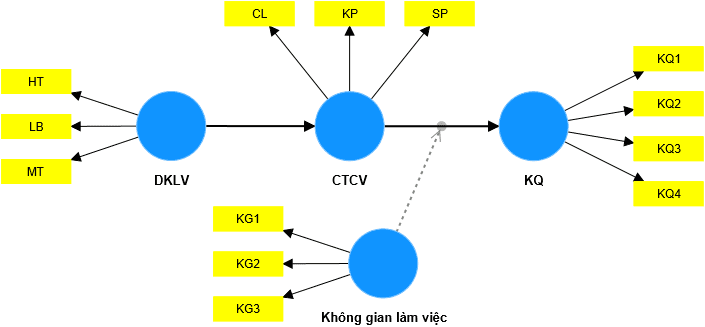
Establish measurement
Specify HOC/LOC relationships, indicators, score directions and identification. Assess the components and their higher-order relationships separately.
Identify the score source
For a two-stage HOC approach, document the first model, scoring method, scaling and use of component scores in the next stage.
Specify the interaction
Ensure predictor and moderator scores have matching cases and scaling conventions. Retain the structural equation’s lower-order terms when adding the product.
Define the inference procedure
Save resampling settings and state which estimation steps are repeated. An analysis of a fixed score table does not automatically propagate all score-construction uncertainty.
Inspect and report
Examine the interaction estimate, interval, conditional slopes and warnings. Document the scoring chain so readers can identify the actual estimand.
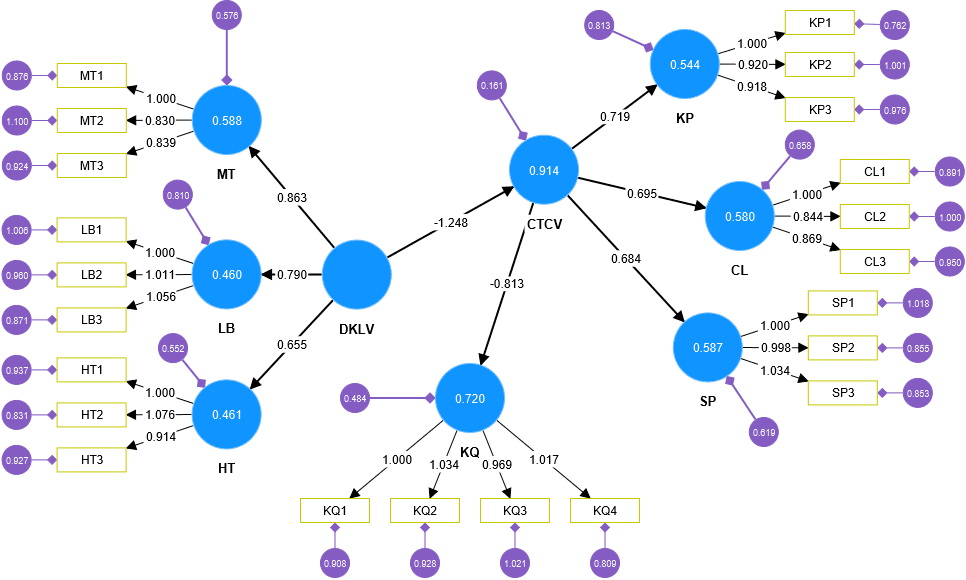
Do not apply one loading/reliability checklist to every higher-order relationship. Removing a formative component may change the construct’s content. Reflective relationships follow a different assessment logic. Select measurement based on meaning rather than which criteria are easier to satisfy (SmartPLS, n.d.-a).
4. Interpret the PLS-SEM interaction and slope plot

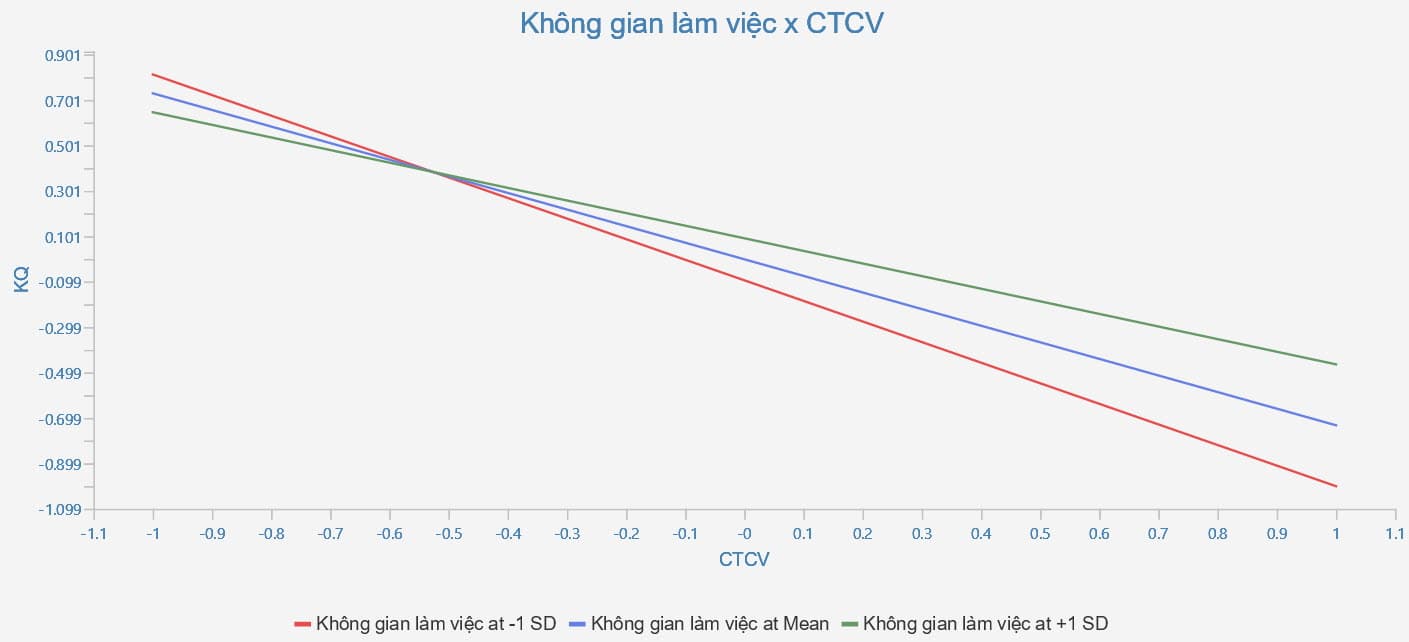
For a linear score-based interaction, Y = b₀ + b₁H + b₂M + b₃HM + ε implies a conditional H slope of b₁ + b₃M. The sign of b₃ depends on score direction and scaling. Interpret it alongside supported moderator values, predicted outcomes and suitable intervals (Hayes, 2022).
The original figures illustrate output; the complete dataset and estimation settings are not supplied here for re-estimation. Do not prefer one framework because one screenshot has a smaller p value. Measurement, scoring, analyzed cases or specification may differ.
5. Exporting factor scores does not retain the entire latent model
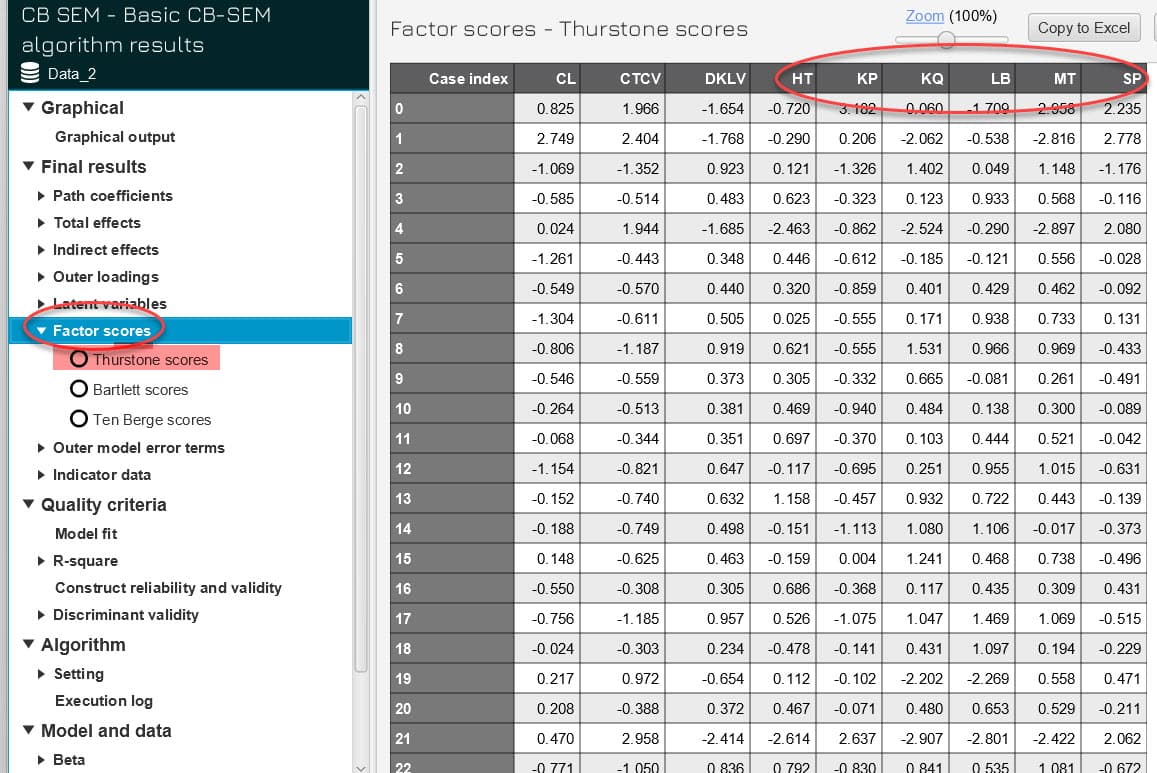
A factor-score table assigns values to cases under a fitted model and scoring method. The screenshot offers Thurstone, Bartlett and Ten Berge options; these should not all be called item means. A regression using the exported columns analyzes the resulting score representatives.
Treating the score table as fixed input does not by itself propagate every source of measurement-stage uncertainty into subsequent standard errors. Consider this limitation when reliability is weak or scores depend strongly on specification. A latent interaction requires a distinct model, consistent with the distinction discussed by Maslowsky et al. (2015).
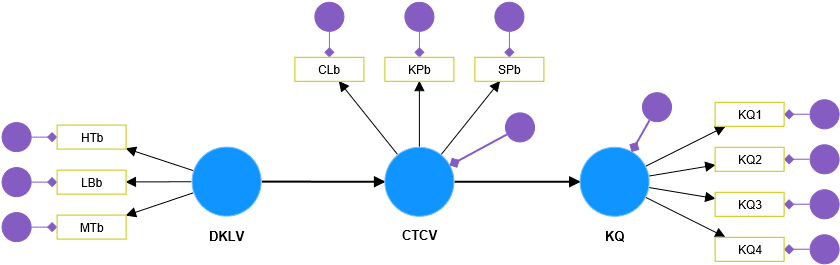
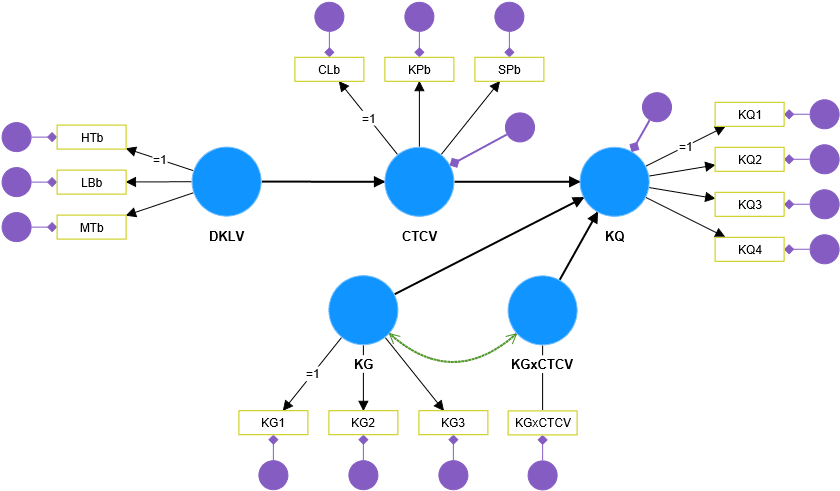
6. Read large standard errors together with large p values
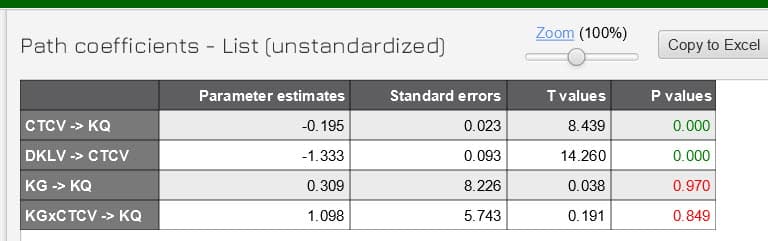
The interaction estimate of 1.098 accompanies SE = 5.743 and p = 0.849. This does not provide clear evidence of interaction under the fitted specification. A positive point estimate does not establish strengthening of the relationship, and a large p value does not establish an absent effect.
The image contains neither confidence intervals nor convergence warnings. It cannot establish the cause of the imprecision. Inspect identification, score variation, predictor dependence, sample size/distribution and the full measurement model before interpreting stability. Report the precision actually achieved (Hayes, 2022; Kline, 2023).
7. Why not automatically split Likert scores at 4?
The original example grouped workspace scores into ≤ 4 and > 4. If the hypothesis concerns a slope changing with workspace level, this changes the question into a comparison between threshold-defined groups. Scores of 3.9 and 4.1 become different groups, while scores of 1 and 4 can be placed together.
Dichotomizing quantitative measures can discard information and produce misleading inference; convenience does not provide a substantive cutoff rationale (MacCallum et al., 2002). This is also a different decision from modeling an individual Likert item as an ordinal measurement indicator.
A cutoff grounded in an independent substantive standard can be justified for a genuinely categorical hypothesis. Specify it before examining results, report group sizes and score distributions, and assess reasonable sensitivity specifications. For a quantitative moderation question, preserve relevant information rather than searching for a favorable split (Hayes, 2022).
8. Separate measurement invariance from structural restrictions
For CB-SEM group comparisons, assess measurement comparability before interpreting structural differences. In a higher-order model this includes relevant component measurement and higher-order relationships. The invariance required depends on the target comparison; comparing means additionally involves intercepts, not just identical-looking diagrams (Kline, 2023).
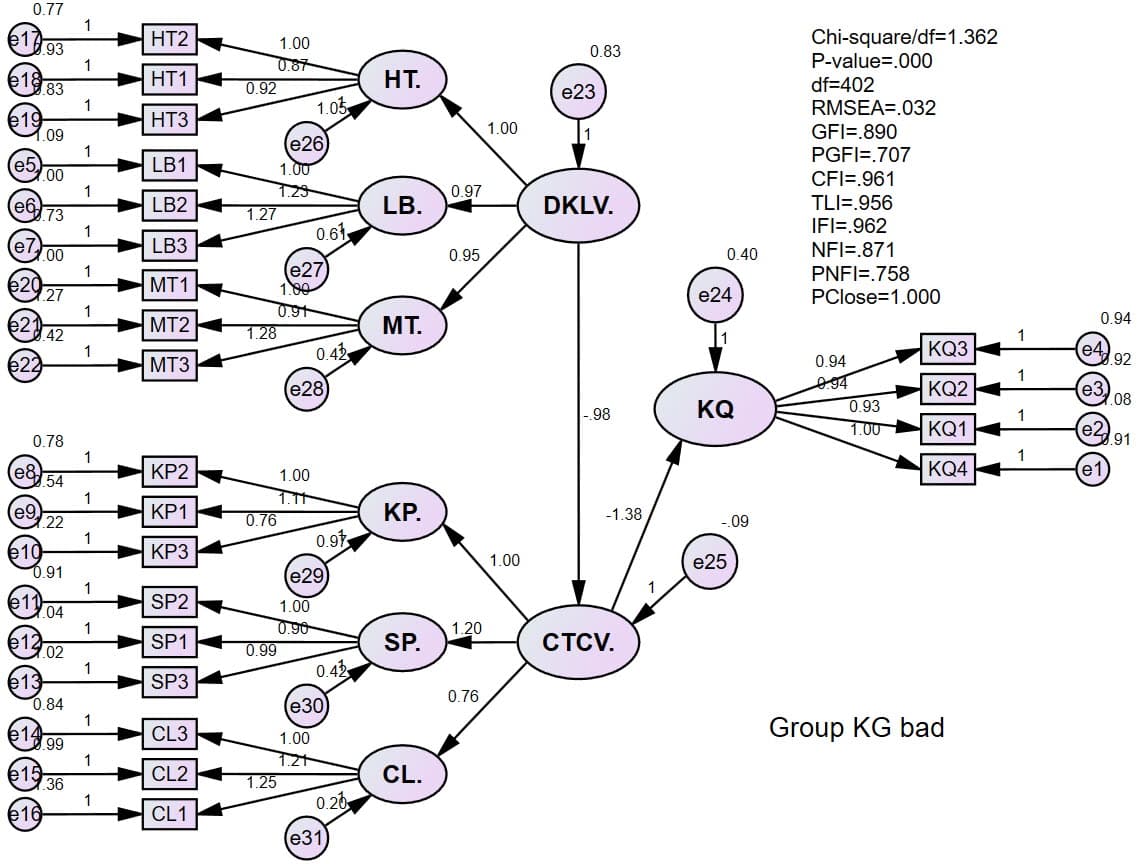
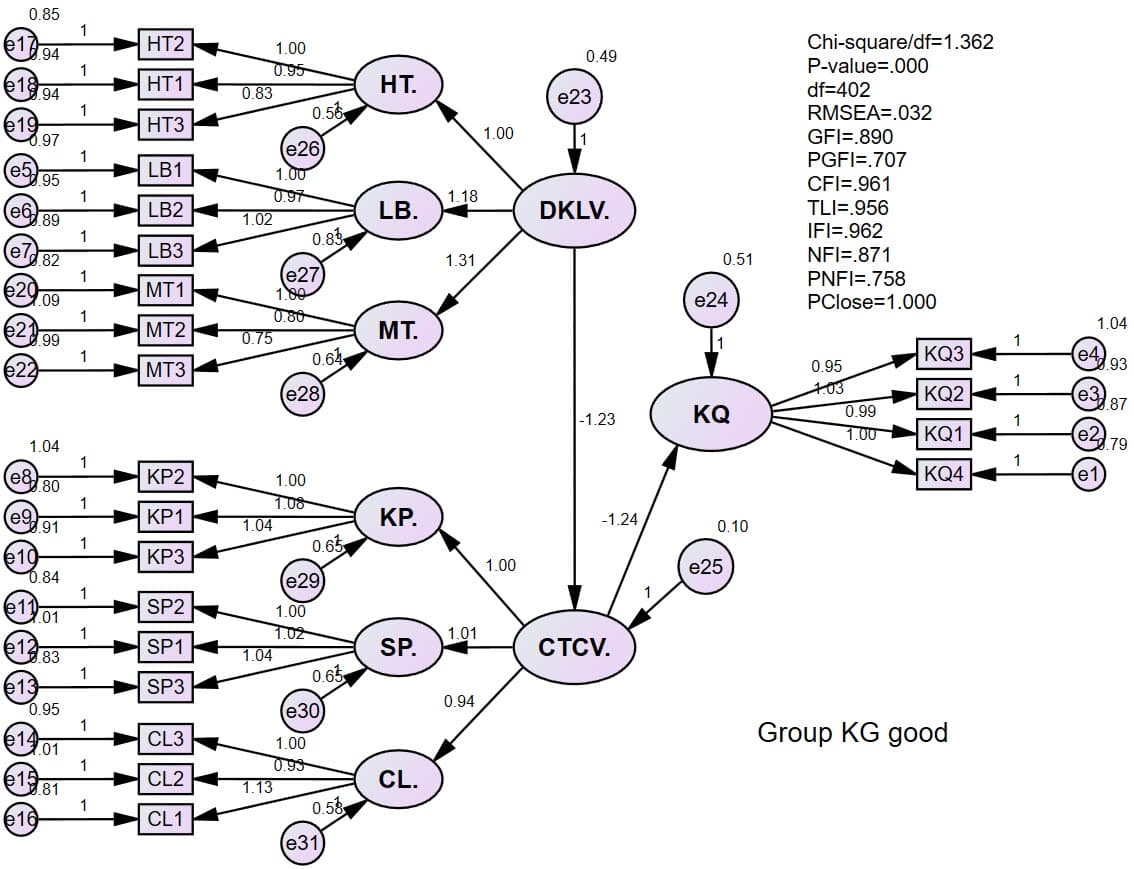
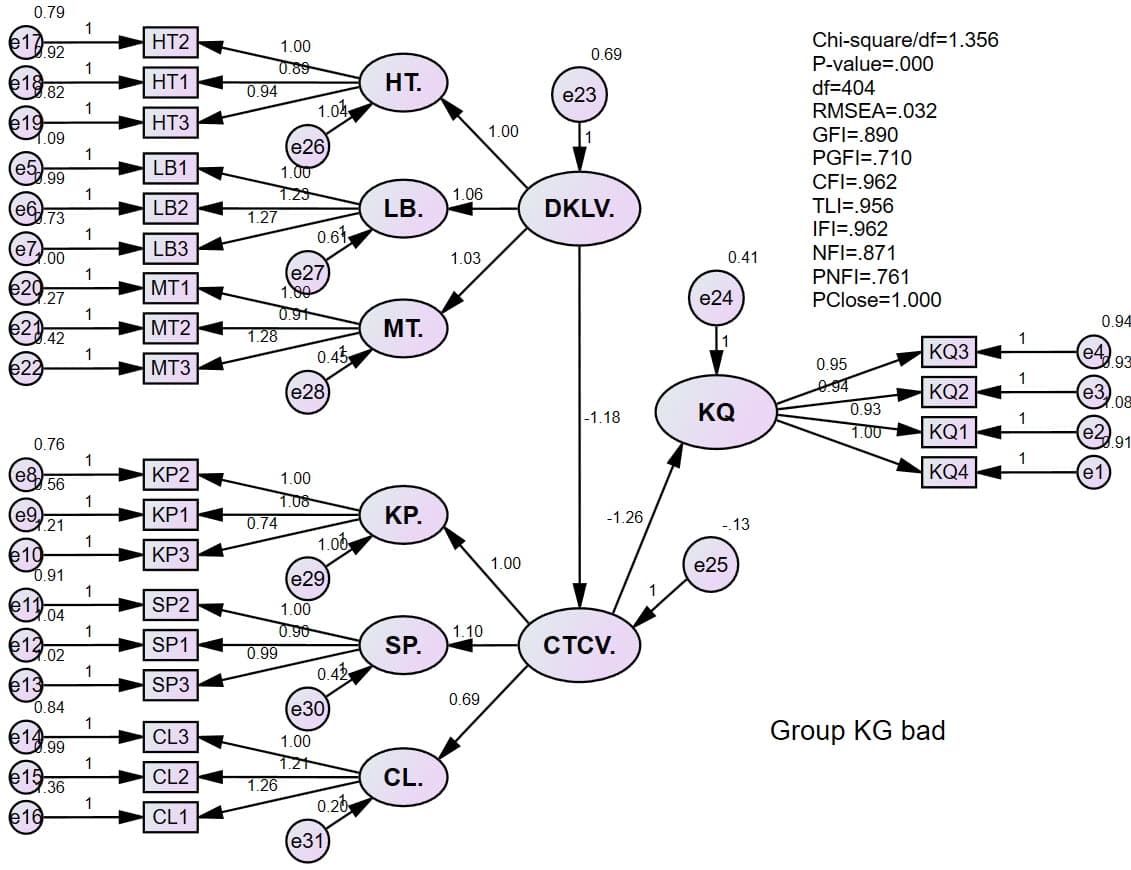
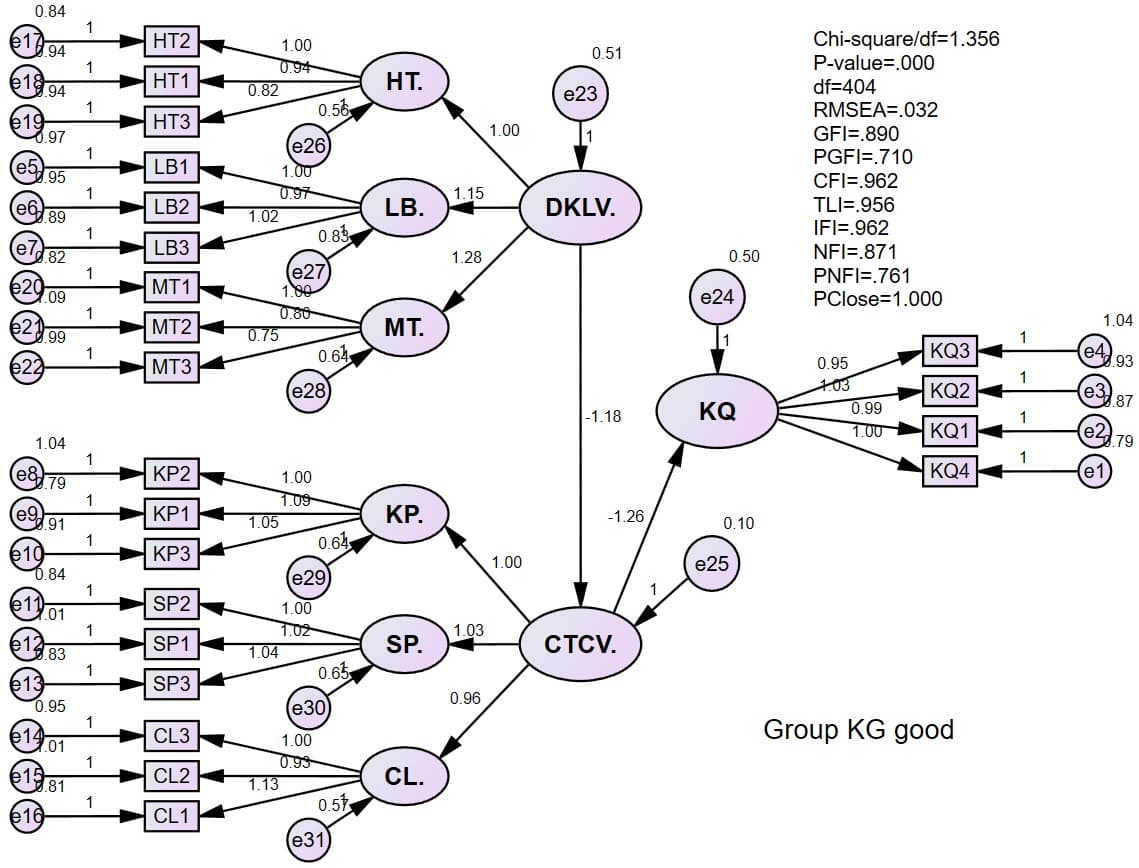
In PLS-SEM, use an appropriate composite-invariance procedure, such as MICOM, before the corresponding group comparisons. MICOM is not the AMOS CFA invariance procedure, and running it does not test every structural path difference (SmartPLS, n.d.-b).
9. A joint restriction test is not a test of each path
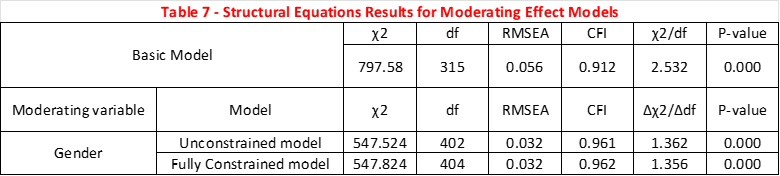
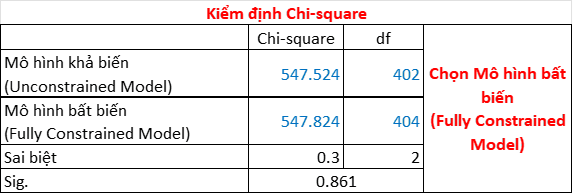
Figure 14 labels the moderator Gender, whereas the preceding grouping discussion concerns workspace (KG). The model files and data are unavailable to establish whether these figures belong to the same analysis. Do not assign the image results specifically to KG or gender without reconciling the original records.
The last image reports χ² = 547.524 with df = 402 and χ² = 547.824 with df = 404. If these are nested ordinary-ML models fitted to the same data with comparable measurement, an illustrative calculation gives Δχ² = 0.300, Δdf = 2 and p approximately 0.861. The screenshot cannot verify these conditions; this is not a reanalysis of the original dataset.
Under those conditions, the comparison does not clearly reject the two restrictions being tested. It does not establish identical population coefficients or practical equivalence, and does not supply a separate conclusion for CTCV → KQ. That question needs a path-specific restriction comparison or direct contrast on comparable measurement and coefficient scales (Kline, 2023).
Do not compare the two within-group p values as evidence that paths differ. Evaluate the coefficient difference and its uncertainty. Robust estimators and bootstrap procedures require appropriate inference rather than mechanically subtracting corrected statistics.
10. Reporting template and checklist
H was specified as [higher-order measurement type] on the basis of [theory]. Moderation was tested using [latent interaction / scores / multigroup SEM]. Scores at each stage came from [model, method and scaling]. We tested [parameter or restriction set] and report [coefficient/difference, CI and p]. Checks addressed [measurement, solution and sensitivity]. Limitations include [score construction, group sizes, design and data support].
- State the higher-order type and the role of each component.
- Distinguish two-stage HOC measurement from two-stage moderation.
- Identify item means, PLS scores or factor scores explicitly.
- Do not split a quantitative moderator merely because interaction estimation is difficult.
- Assess measurement comparability at the relevant levels.
- Specify exactly which paths are constrained and tested.
- Interpret p values alongside intervals, magnitude and estimate stability.
Preserving the intended construct across stages makes moderation results interpretable. When scoring or grouping changes the analytical target, the report must make that change explicit.
Further reading
Interactions and interpretation in AMOS; Practical higher-order modeling; MICOM and multigroup comparisons.
References
- Hayes, A. F. (2022). Introduction to mediation, moderation, and conditional process analysis: A regression-based approach (3rd ed.). The Guilford Press. https://www.afhayes.com/introduction-to-mediation-moderation-and-conditional-process-analysis.html
- Kline, R. B. (2023). Principles and practice of structural equation modeling (5th ed.). The Guilford Press. https://www.guilford.com/books/Principles-and-Practice-of-Structural-Equation-Modeling/Rex-Kline/9781462551910
- MacCallum, R. C., Zhang, S., Preacher, K. J., & Rucker, D. D. (2002). On the practice of dichotomization of quantitative variables. Psychological Methods, 7(1), 19–40. https://doi.org/10.1037/1082-989X.7.1.19
- Maslowsky, J., Jager, J., & Hemken, D. (2015). Estimating and interpreting latent variable interactions: A tutorial for applying the latent moderated structural equations method. International Journal of Behavioral Development, 39(1), 87–96. https://doi.org/10.1177/0165025414552301
- SmartPLS (n.d.-a). Higher-order models. https://smartpls.com/documentation/algorithms-and-techniques/extended-relationships/higher-order/
- SmartPLS (n.d.-b). Measurement invariance assessment (MICOM). https://smartpls.com/documentation/algorithms-and-techniques/heterogeneity-and-multigroup/micom/
- SmartPLS (n.d.-c). Moderation analysis in PLS-SEM. https://smartpls.com/documentation/algorithms-and-techniques/extended-relationships/moderation/