
Moderation in AMOS: Specifying Interactions and Interpreting the Evidence
A structural relationship may vary with gender, age or working conditions. Before analyzing moderation in AMOS, establish whether the interacting quantities are observed scores or latent variables. That choice determines the specification, test and interpretation.
Moderation concerns a change in the X–Y relationship with M. Specify the interaction correctly, retain the lower-order terms and examine estimates with uncertainty. A nonsignificant p value does not establish that an effect is zero.
1. Translate the research question into a testable parameter
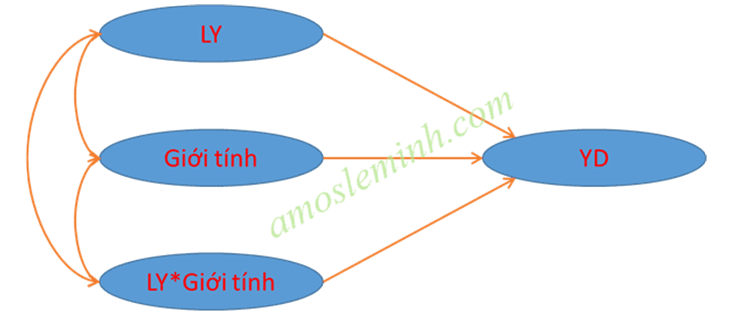
Suppose the question concerns brand loyalty (LY), repeat purchase intention (RI) and gender. Gender moderates the LY–RI relationship only if that relationship varies with gender. Whether gender has its own association with RI is a different question, represented by a different parameter in a linear interaction model (Hayes, 2022).
Record X, Y and M, how each is measured, the reference category and theoretically justified adjustment variables before opening the software. An arrow from M to the X → Y arrow is a conceptual illustration. It does not tell SEM software how to estimate the interaction.
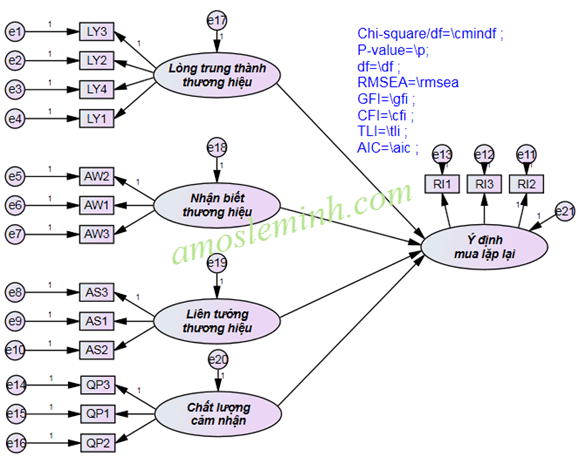
2. Choose observed scores, a latent interaction or multigroup SEM
| Strategy | Inputs and estimand | Requirement |
|---|---|---|
| Observed-score interaction | Measured variables or total/mean scores, with X, M and X×M in the equation. | Inference concerns the scores used; their measurement error is not automatically modeled. |
| Latent interaction | A measurement model represents X and/or M; an appropriate latent-interaction method is specified. | Identification and constraints require a separate justification. Multiplying exported scores is not itself a latent interaction. |
| Multigroup SEM | Meaningful pre-existing groups; one or more structural paths are compared. | Comparable measurement and a direct test of the coefficient difference are required. |
A mean score entered in a rectangle is an observed variable, even when several questionnaire items contributed to it. If the constructs remain factors measured by items, consider a method that addresses the latent structure. Maslowsky et al. (2015) explain LMS using Mplus; that tutorial is not an AMOS LMS menu sequence.
An AMOS product-indicator approach needs a justified specification of indicators, residuals and constraints. There is no universal item-multiplication recipe in this article. Comparing existing groups may be appropriate, provided the target structural comparison is explicit (Kline, 2023).
3. Construct an interaction for observed scores
For a binary moderator coded 0/1, consider the equation below. C denotes prespecified adjustment variables and Xc is X minus a meaningful reference value, such as its sample mean. The X slope is b₁ when M = 0 and b₁ + b₃ when M = 1. Thus b₃ is their difference within this model (Hayes, 2022).
Retain Xc and M when adding Xc×M, regardless of their individual p values. A moderator with three or more categories requires an appropriate coding system and corresponding interactions. Category labels 1, 2 and 3 do not justify treating the categories as equally spaced quantitative values.
In the full linear interaction model, mean-centering changes the reference point for interpreting lower-order coefficients. It does not correct measurement error or endogeneity, and does not create moderation. Standardizing every variable is not a prerequisite for testing an interaction (Hayes, 2022).
* M is already coded 0/1; X and M need explicit definitions.
* The reference value 4 is an analyst-chosen illustration.
COMPUTE Xc = X - 4.
COMPUTE INT = Xc * M.
EXECUTE.
Check several rows by hand, declare missing-value codes and retain the same cases for models that must be compared. For a continuous moderator, preserve its quantitative information and probe values supported by the observed data.
4. An AMOS workflow for an observed-score model
Finalize data and scoring
Save the codebook, item direction, missing-data rules and X/M/Y scoring formulas. State that these are observed scores.
Attach the data file
In AMOS Graphics, use File → Data Files. Check variable names, types, analyzed cases and any group assignments.
Specify the equation
Include Xc → Y, M → Y, INT → Y and justified adjustments. Specify appropriate covariances among predictors and a disturbance for Y.
Select estimation and output
Justify the estimator against measurement and data assumptions. Under Analysis Properties → Output, request relevant output and inspect Estimate, S.E., C.R. and P in Regression Weights.
Inspect the solution
Run Calculate Estimates, then examine warnings, identification, convergence and improper estimates before interpreting INT. A just-identified model with df = 0 does not offer a discriminating global-fit test.
Save estimates and uncertainty
Retain the model and settings. When bootstrapping, report the interval method, requested/valid resamples and convergence failures. Conditional slopes require intervals for the relevant parameter combination.
Menu labels can vary across AMOS versions. Reproducing the appearance of a diagram is insufficient: scoring, estimator, cases and constraints must also match. Measurement and solution checks remain necessary (Kline, 2023).
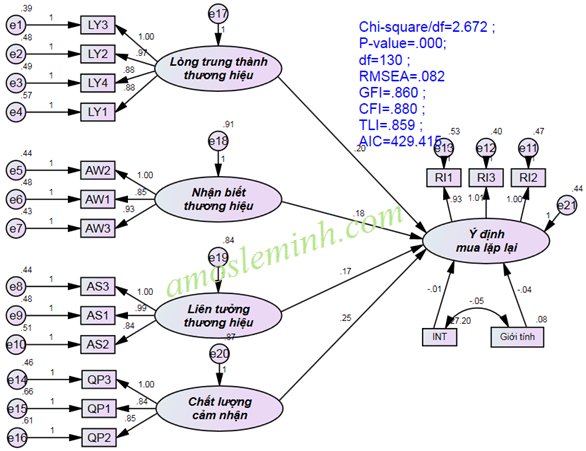
5. Reinterpret the original output
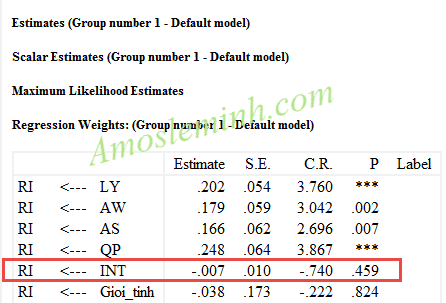
The displayed p = 0.459 does not provide clear evidence against a zero interaction coefficient in the fitted model. It does not establish the absence of moderation in the population. An imprecise or insufficiently sensitive analysis can leave a range of nonzero effects compatible with the data (Hayes, 2022).
The screenshot supplies no confidence interval, sample size or gender codebook. Consequently, it cannot establish practical equivalence or identify which coded gender category is the reference. Do not reconstruct an exact test from rounded coefficients. This survey model alone also does not establish causality.
A report consistent with the image: The LY × gender interaction was not statistically significant in the fitted model (B = −0.007, SE = 0.010, p = 0.459). The analysis did not provide clear evidence that the LY–RI relationship differed under the gender coding used. A confidence interval and design information are needed to assess which effect sizes remain compatible with the data.
6. Conditional slopes and their confidence intervals
The standard error is the square root of the variance above. Do not add the two standard errors or their separate interval endpoints. Use the covariance between parameter estimates or bootstrap the actual parameter combination (Hayes, 2022).
| Assumed information | Value | Interpretation |
|---|---|---|
| Group codes | M = 0 and M = 1 | Illustrative categories, not gender assignments inferred from the image. |
| b₁; b₃; SE(b₃) | 0.40; 0.08; 0.10 | The estimated slopes are 0.40 and 0.48. |
| Approximate 95% Wald interval for b₃ | [−0.116, 0.276] | Computed as 0.08 ± 1.96×0.10 using a normal approximation. |
| Approximate two-sided p for b₃ | 0.424 | The hypothetical estimates do not clearly distinguish the difference from zero. |
These numbers were constructed for teaching. A larger slope in one group does not establish a difference. Nor does significance in one group and nonsignificance in the other replace a direct interaction or coefficient-difference test. Plot conditional predictions with the same adjustment values and avoid extrapolating outside data support.
7. For multigroup SEM, examine measurement comparability first
Multigroup SEM asks whether a path coefficient differs across groups. For latent factors, inspect measurement comparability, scale identification and indicator meaning. Configural invariance concerns the measurement pattern, metric invariance concerns loadings, and scalar invariance adds intercept constraints relevant to mean comparisons (Kline, 2023).
In AMOS, declare groups using Manage Groups, attach the correct data and specify which parameters are free or equal. For a targeted path comparison, compare the model with that path free across groups against one constraining that path, given a defensible measurement model. Constraining every structural path jointly is not a path-specific test for LY → RI.
A conventional χ² difference test requires appropriately nested ordinary-ML models fitted to the same data. Robust estimators or different data treatments may require a corrected procedure. Failure to reject equality is not evidence of practical equivalence; such a conclusion needs a meaningful difference criterion and uncertainty assessment (Kline, 2023).
8. Reporting template and reproducibility record
We tested moderation using [observed scores / a latent interaction / multigroup SEM] because [measurement and hypothesis rationale]. M was coded [rule and reference group], and X was referenced to [value]. The model retained lower-order terms and adjusted for [justified variables]. The interaction or path difference was [B], with [SE, CI, p and interval method]. Inference is limited by [sample, measurement and design].
- Distinguish means, factor scores and latent variables.
- Retain X and M when including their interaction.
- Test the interaction or coefficient difference directly.
- Report units, reference coding, estimates and confidence intervals.
- Save warnings, model files and estimation settings.
- Do not change cutoffs or groups after seeing p values to obtain a preferred result.
A useful moderation analysis identifies the tested parameter and the effect sizes compatible with the data. Adding INT completes only the initial specification.
Further reading
Moderation plots and conditional slopes; Moderation in higher-order models.
References
- Hayes, A. F. (2022). Introduction to mediation, moderation, and conditional process analysis: A regression-based approach (3rd ed.). The Guilford Press. https://www.afhayes.com/introduction-to-mediation-moderation-and-conditional-process-analysis.html
- Kline, R. B. (2023). Principles and practice of structural equation modeling (5th ed.). The Guilford Press. https://www.guilford.com/books/Principles-and-Practice-of-Structural-Equation-Modeling/Rex-Kline/9781462551910
- Maslowsky, J., Jager, J., & Hemken, D. (2015). Estimating and interpreting latent variable interactions: A tutorial for applying the latent moderated structural equations method. International Journal of Behavioral Development, 39(1), 87–96. https://doi.org/10.1177/0165025414552301