
Choosing CB-SEM, PLS-SEM, or PLSc According to the Research Objective
Software names do not determine the method. A sound choice begins with the nature of the constructs, the estimand, the data, and the evidence the study seeks to produce.
CB-SEM is often suitable when the model targets common factors, parameters, and covariance structures. PLS-SEM generates composite scores and is useful for explanatory or predictive objectives. PLSc corrects PLS Mode A when constructs are specified as common factors. Small samples or skewed data do not automatically dictate PLS-SEM.
1. Start with Constructs Rather Than Software
A common factor is assumed to be the common cause of correlations among indicators. Indicators are imperfect manifestations of the latent variable, so the model must account for measurement error and reproduce the covariance structure. CFA and most CB-SEM applications begin with this logic.
A composite is created from a combination of observed variables. Its components determine its content, so removing a component may change the concept. A causal-formative model also directs arrows from indicators to the construct, but causal indicators are not synonymous with composite indicators. Bollen and Bauldry (2011) show that these three variable types must be distinguished when specifying measurement models.
Composites can be modeled in multiple SEM frameworks. Grace and Bollen (2008) discuss their role in SEM, while recent developments show that both CB-SEM and PLSc can accommodate models combining common factors and composites under appropriate specification conditions (Henseler & Schuberth, 2025).
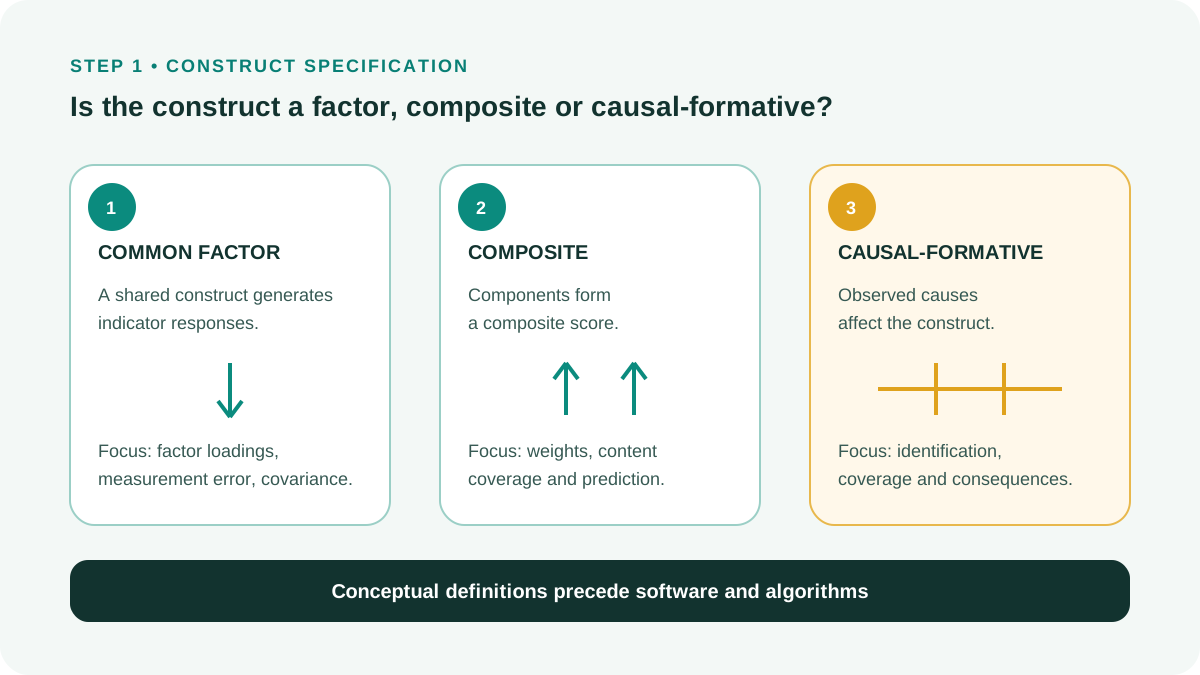
| Construct type | Relationship with indicators | Question to address |
|---|---|---|
| Common factor | A common construct generates indicator responses | Do the indicators reflect the same latent variable? |
| Composite | Components form a composite score | Which combination represents the defined concept? |
| Causal-formative | Observed causes affect the construct | Do the causes adequately cover the content domain, and is the model correctly identified? |
2. What Do CB-SEM, PLS-SEM, and PLSc Estimate?
CB-SEM usually estimates common-factor model parameters so that the model-implied covariance matrix approximates the observed matrix. Researchers can test constraints, compare models, and assess overall discrepancy. Conclusions still depend on the estimator, sample size, distribution, identification, and specification quality.
PLS-SEM generates composite scores using weights and then estimates relationships among the composites. This suits theoretically justified composites or objectives emphasizing explanation and prediction of target variables. PLS-SEM does not automatically turn a factor scale into a valid composite (Rigdon, 2016; Hair & Alamer, 2022).
PLSc applies a correction for attenuation to Mode A constructs specified as common factors. Its purpose is to make PLS-based estimates more consistent with the common-factor model. PLSc is not the default choice for every model and must not be used to transform a composite into a factor (Dijkstra & Henseler, 2015; SmartPLS, n.d.).
| Method | Primary target | Evidence to prioritize | Limitation to report |
|---|---|---|---|
| CB-SEM | Common factors, covariance, and parameters | Fit, parameters, CIs, model comparisons | Sensitive to specification and estimator |
| PLS-SEM | Composite scores and predictive relationships | Weights/loadings, R², f², PLSpredict, CVPAT | Does not replace a factor model when theory requires factors |
| PLSc | Common factors through PLS correction | Loadings, paths, CIs, and robustness checks | Appropriate only when the common-factor assumption is justified |
3. Five Commonly Misstated Reasons for Method Selection
The 10-times rule is insufficient justification for PLS-SEM sample size. Kock and Hadaya (2018) show that it can yield inaccurate estimates and propose methods tied to the minimum path coefficient to be detected. For complex models or specific testing objectives, power analysis or Monte Carlo simulation usually makes assumptions more explicit.
Likert data with few categories do not dictate an automatic choice either. When the objective is common-factor CFA or SEM, a categorical estimator such as WLSMV may be more appropriate than ordinary ML, especially with fewer than five categories and asymmetric thresholds. Performance also depends on sample size and the latent distribution (Rhemtulla et al., 2012).
| Weak rationale | Why it is insufficient | Better justification |
|---|---|---|
| Use PLS because the data are skewed | CB-SEM offers robust estimators and bootstrapping | State variable types, degree of skewness, estimator, and objective |
| Use PLS because the sample is small | Every estimator requires sufficient information and power | Use power analysis or simulations based on the effect to be detected |
| Formative measurement requires PLS | CB-SEM can specify composites or causal indicators | Explain the construct type and identification conditions |
| PLS has no assumptions | PLS still depends on specification, data, and bootstrap inference | Report settings, collinearity, stability, and prediction |
| PLSc is always better than PLS | The correction targets only common-factor models | Use PLSc when reflective constructs are genuinely treated as factors |
4. A Practical Decision Tree
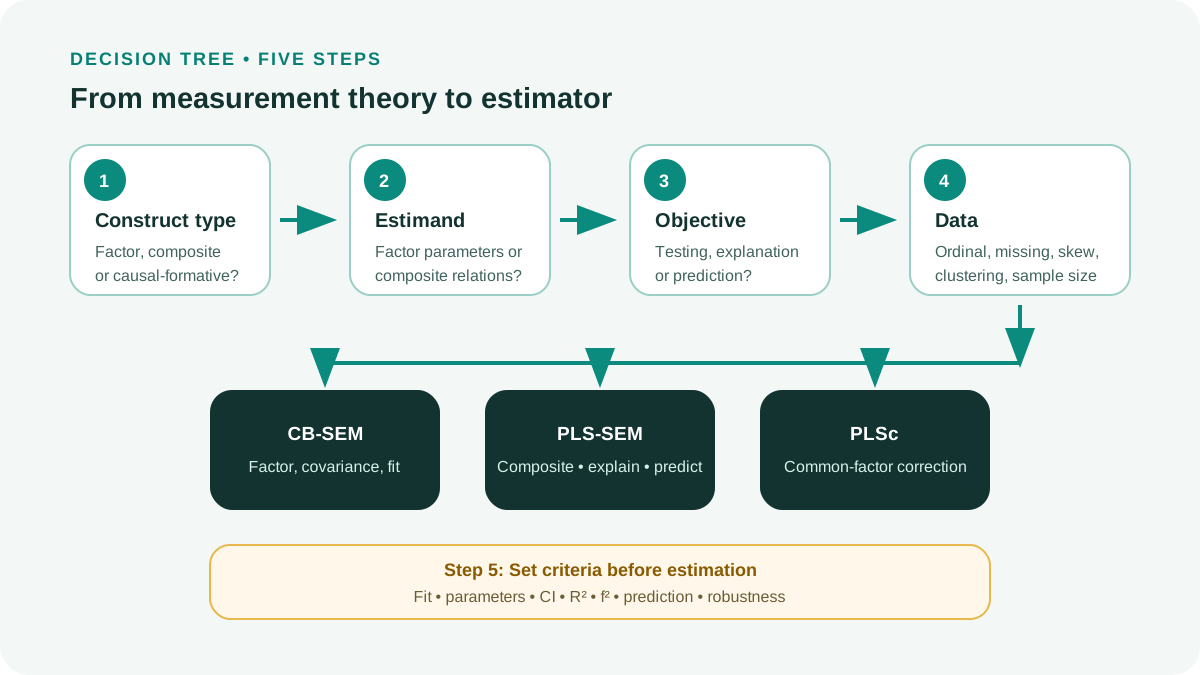
Define each construct
Write conceptual definitions and identify common factors, composites, or causal-formative constructs. If unclear, pause software selection and return to measurement theory.
Finalize the estimand
Identify whether the target is relationships among factors, relationships among composites, total effects, or the predictive ability for target variables.
Finalize the evidential objective
Testing covariance structures and constraints generally favors CB-SEM; composites with prediction favor PLS-SEM; common factors estimated through PLS may warrant PLSc.
Choose an estimator for the data
Consider ordinal measurement, missing data, distributional skewness, clustering, and sample size. Select robust ML, WLSMV, bootstrapping, or another suitable procedure within the chosen method family.
Set criteria before running analyses
Document the fit, parameters, CIs, R², f², prediction, and robustness checks to be used. Do not change criteria after seeing which method gives more favorable results.
AMOS, SmartPLS, R, Mplus, and Stata are implementation environments. Software does not determine whether a construct is a factor or composite, nor does it repair a weak theoretical model.
5. Three Situations for Applying the Decision Tree
Actual studies may contain both factors and composites. Researchers then need software and estimators capable of handling mixed models and must document how each construct is estimated. Do not force the entire model into one type merely because it is more convenient in the available software.
The fact that a method runs does not establish a defensible design. A model may converge while its estimand does not match the question, or composite scores may predict well in sample without substantive meaning.
| Situation | Rationale | Initial choice |
|---|---|---|
| CFA of a 5-factor psychological scale, aiming to test its structure | Indicators manifest factors; fit assessment and model comparisons are required | CB-SEM with an estimator suited to the data |
| A digital-capability index formed from infrastructure, skills, and processes | The concept is a composite; the objective is performance prediction | PLS-SEM or explicitly specified composite SEM |
| Reflective scales, using a PLS algorithm to compare common-factor estimates | Common factors are justified; correction for attenuation is needed | PLSc as the prespecified primary or sensitivity analysis |
6. If Using Two Methods, Design the Comparison as a Sensitivity Analysis
Running CB-SEM, PLS-SEM, and PLSc on the same data can assess sensitivity, but the methods must target sufficiently similar quantities for comparison. If one model treats a construct as a factor and another treats it as a composite, coefficient differences may reflect different estimands rather than software errors.
The comparison plan should prespecify coefficient signs and magnitudes, confidence intervals, the ordering of conclusions, fit, R², and out-of-sample prediction. When results differ, report both and explain the methodological reasons. Do not select output with smaller p-values as the primary results after examining the data.
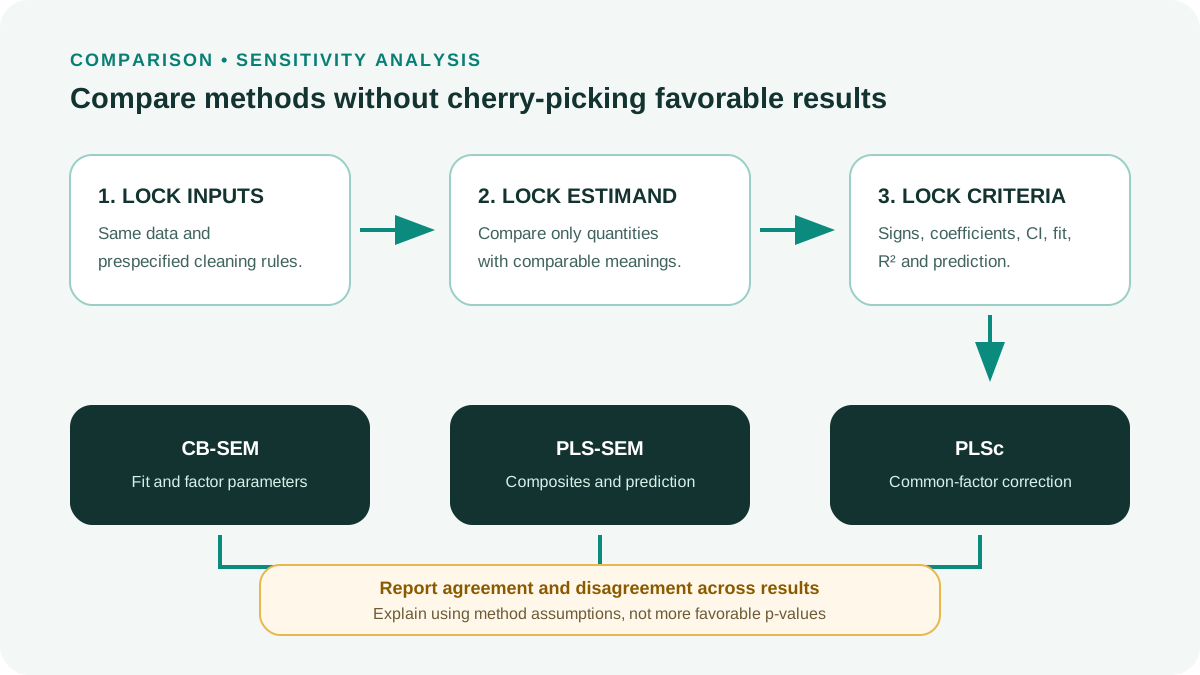
- Use the same data version and cleaning rules.
- Explicitly document construct and path specifications for each method.
- Ensure estimands are sufficiently similar for comparison.
- Prespecify comparison criteria.
- Interpret differences in light of the methods’ assumptions.
- Report unfavorable results too.
7. Method-Selection Rationale Template and Checklist
Example report
The study used [CB-SEM/PLS-SEM/PLSc] because [constructs] were specified as [common factors/composites/causal-formative] and the primary estimand was [ ]. The analytical objective was [testing the covariance structure/parameter estimation/explanation/prediction]. The data comprised [variable types, category counts, missing data, distributions], so [estimator and treatment] were selected. Sample size was determined using [power/Monte Carlo/stated method] for [minimum effect]. Robustness was assessed using [sensitivity analysis], with prespecified criteria.
- Classify each construct using measurement theory.
- Document the estimand and evidential objective in advance.
- Do not use small sample size or nonnormality as the sole rationale.
- Match the estimator to variable types and missing data.
- Use PLSc only for justified common-factor correction.
- Do not base sample size solely on the 10-times rule.
- Present cross-method comparisons as sensitivity analyses.
- Report software, version, settings, and assessment criteria.
Conclusion
Choosing CB-SEM, PLS-SEM, or PLSc is a decision about the model and estimand. Data inform estimator selection but do not replace construct definitions and research objectives.
A sound rationale lets readers trace the software choice back to the estimand, measurement theory, and assessment criteria. Wherever this chain breaks, the method choice requires reconsideration.
References
- Bollen, K. A., & Bauldry, S. (2011). Three Cs in measurement models: Causal indicators, composite indicators, and covariates. Psychological Methods, 16(3), 265-284.https://doi.org/10.1037/a0024448
- Dijkstra, T. K., & Henseler, J. (2015). Consistent partial least squares path modeling. MIS Quarterly, 39(2), 297-316.https://doi.org/10.25300/MISQ/2015/39.2.02
- Grace, J. B., & Bollen, K. A. (2008). Representing general theoretical concepts in structural equation models: The role of composite variables. Environmental and Ecological Statistics, 15(2), 191-213.https://doi.org/10.1007/s10651-007-0047-7
- Hair, J. F., & Alamer, A. (2022). Partial least squares structural equation modeling (PLS-SEM) in second language and education research: Guidelines using an applied example. Research Methods in Applied Linguistics, 1(3), 100027.https://doi.org/10.1016/j.rmal.2022.100027
- Henseler, J., & Schuberth, F. (2025). Should PLS become factor-based or should CB-SEM become composite-based? Both! European Journal of Information Systems, 34(3), 551-563.https://doi.org/10.1080/0960085X.2024.2357123
- Kock, N., & Hadaya, P. (2018). Minimum sample size estimation in PLS-SEM: The inverse square root and gamma-exponential methods. Information Systems Journal, 28(1), 227-261.https://doi.org/10.1111/isj.12131
- Rhemtulla, M., Brosseau-Liard, P. É., & Savalei, V. (2012). When can categorical variables be treated as continuous? A comparison of robust continuous and categorical SEM estimation methods under suboptimal conditions. Psychological Methods, 17(3), 354-373.https://doi.org/10.1037/a0029315
- Rigdon, E. E. (2016). Choosing PLS path modeling as analytical method in European management research: A realist perspective. European Management Journal, 34(6), 598-605.https://doi.org/10.1016/j.emj.2016.05.006
- SmartPLS. (n.d.). Consistent PLS-SEM (PLSc-SEM) algorithm in SmartPLS.https://smartpls.com/documentation/algorithms-and-techniques/core-algorithm/consistent-pls/
Academic note: This article uses factor, composite, and estimand in their methodological senses. No rule based solely on sample size, distribution, or software name determines the SEM family.