
Research Scale Development: A 9-Step Process from Construct Definition to CFA Validation
An item set with high alpha is not necessarily a good scale. Scale development must begin with the conceptual domain, protect content validity, and separate exploration from confirmation.
This article turns scale development into practical decision points: choosing existing scales or developing new ones, mapping domains, generating items, calculating I-CVI and S-CVI, conducting cognitive interviews, selecting correlation matrices and estimators, conducting EFA and CFA, and reporting validity evidence.
1. Learning Objectives and Prerequisites
After this article, you should distinguish new development, adaptation, and revalidation; map conceptual domains; organize expert reviews and cognitive interviews; select EFA and CFA data; and report reliability and validity evidence without turning cutoffs into automatic item-removal mechanisms.
DeVellis and Thorpe (2022) place clear identification of what is to be measured first. Without clear theory, conceptual scope, and score-use purposes, later factor analysis can only organize ambiguous items into an even more ambiguous structure.
- Provide a theoretically grounded conceptual definition.
- Know whether scores serve group description, relationship testing, or individual decisions.
- Review existing scales and usage rights.
- Clearly identify the population, language, and application context.
- Have resources for at least one pilot round and an independent confirmation step.
- Plan to retain all removed items and their removal reasons.
2. First: Develop, Adapt, or Use an Existing Scale Unchanged?
New development is justified only when existing scales do not cover the concept, population, language, or score purpose. Using or carefully adapting a suitable instrument generally preserves comparability and resources. Boateng et al. (2018) recommend confirming that no existing instrument meets the purpose before creating a new scale.
Translation involves more than replacing words. Check conceptual, linguistic, response, and score-use equivalence. Following adaptation, prior evidence does not automatically transfer intact to the new context.
| Strategy | Appropriate when | Minimum requirements |
|---|---|---|
| Use unchanged | Same concept, language, population, and purpose | Check usage rights, structure, and reliability in the new sample |
| Adapt | A close instrument exists but language or context differs | Translation and reconciliation, expert review, cognitive interviews, and structural revalidation |
| Develop anew | A genuine conceptual or measurement-purpose gap | The complete item-generation, exploration, and confirmation process |
3. Define the construct and map its domain
A working definition specifies what the concept is, its dimensions, its differences from neighboring concepts, and its intended population and context. Clark and Watson (2019) treat clear conceptualization, broad item pools, and comparisons with related concepts as foundations of construct validity.
Record two threats in the domain map: construct underrepresentation and construct-irrelevant variance. An overly narrow domain omits content; an overly broad domain includes items measuring other characteristics. Content validity concerns scale use within a population and context rather than a fixed instrument label (DeVellis and Thorpe, 2022).
| Component | Question to address | Product |
|---|---|---|
| Definition | What is the concept, and what is outside it? | A sourced working definition |
| Dimensions | Which manifestations or subdomains exist? | A dimension list and descriptions |
| Neighboring concepts | What must be distinguished? | Discriminant and relational hypotheses |
| Population | Whose language and experiences? | Respondent profile |
| Score purpose | Which inferences will scores support? | Use statement and risk level |
4. Decide first: a reflective scale or a formative index?
The item correlations, EFA, CFA and internal-consistency procedures in this guide primarily concern reflective scales, whose items express a common attribute. Sharing a topic does not establish a shared latent cause. Chapter 7 of DeVellis and Thorpe (2022) distinguishes such scales from indices defined by their components. Neither the label scale nor the presence of Likert responses resolves that distinction.
Constructed example: expressions of trust in an adviser’s competence might be hypothesized to reflect one common dimension. Numbers of consultations, available support channels and waiting time are different service components. Combining them into an index makes the chosen components part of its definition. Do not remove a component solely because alpha is low, or force the components into one factor to obtain high internal consistency (DeVellis & Thorpe, 2022).
| Question | Reflective scale | Formative index |
|---|---|---|
| Construct–item relationship | A common attribute is hypothesized to generate the responses | Components contribute to defining the aggregate |
| Must items covary? | Expected under the model and checked empirically | Not necessarily; high correlations do not define the index |
| Removing an item | Consider content loss and measurement quality | May alter the meaning of the index itself |
| Alpha and EFA/CFA | Useful when their measurement assumptions are defensible | Not automatic criteria for selecting or removing components |
5. Three phases and nine steps: distinguish the source frameworks
Boateng et al. (2018) describe three phases and nine steps: item development covers domain identification/item generation and content validity; scale development covers pretesting, sampling, item reduction and factor extraction; scale evaluation covers dimensionality, reliability and validity. The illustration below is an integrated teaching map, not a reproduction of the authors’ procedure table.
The nine steps in chapter 5 of DeVellis and Thorpe (2022) divide the work differently: define the target attribute, generate items, choose the format, obtain expert review, conduct cognitive interviews, consider validation items, collect a development sample, evaluate items and optimize length. The fourth edition has eight steps and does not separate cognitive interviewing into its own step (DeVellis, 2017). Equal step counts do not make the frameworks interchangeable; the detailed sections below follow practical decisions.
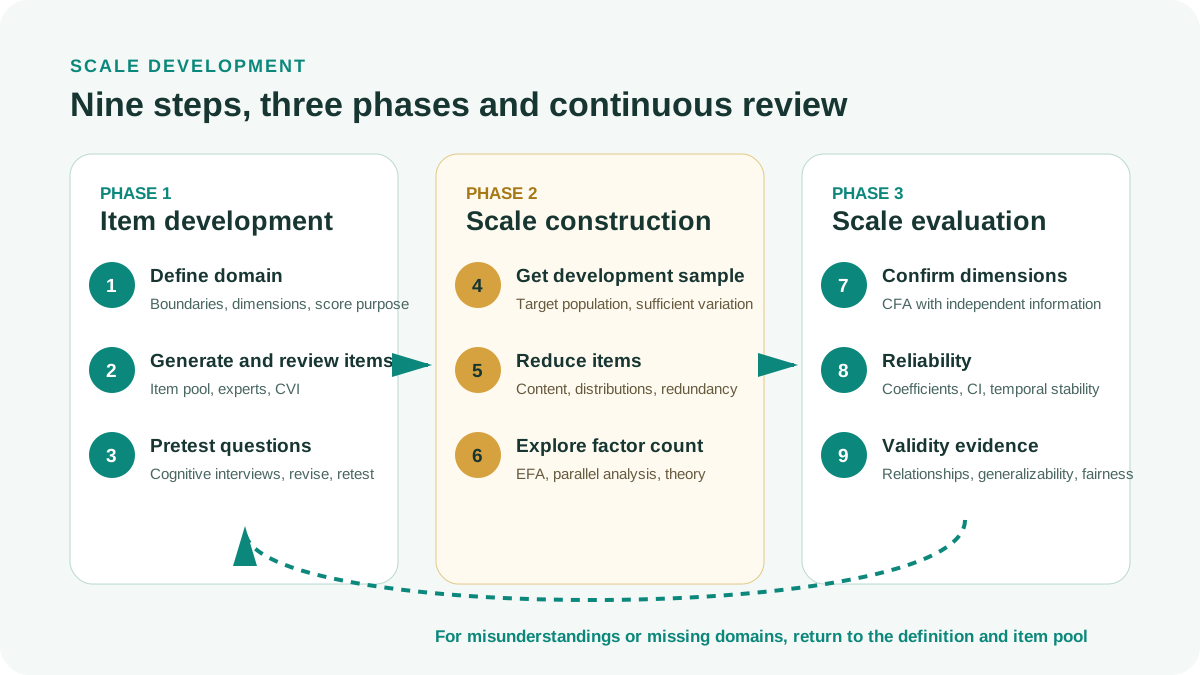
Identify the domain and generate items
Define boundaries and candidate dimensions; combine theory with the target population’s experience.
Gather content-validity evidence
Examine relevance, domain coverage and interpretation with experts and intended respondents.
Pretest the questions
Investigate interpretation, retrieval and response selection; justify revisions and retest them.
Collect a development sample
Choose appropriate participants and administration conditions; plan sample size for the intended analysis.
Reduce items with evidence
Combine coding, distributions, content judgments and statistical information.
Extract factors
Explore dimensionality with suitable methods; do not equate PCA with common-factor analysis.
Test dimensionality
Where the design permits, evaluate the proposed structure using information not used for selecting items.
Estimate reliability
Match the coefficient to the score model, report uncertainty and assess temporal stability when relevant.
Accumulate validity evidence
Test anticipated relationships and bound interpretations by population, setting and intended use.
6. Generate a broad item pool within the construct boundary
The initial pool should be larger than the final scale, giving every domain component several opportunities for representation. Conceptual redundancy can help, but nearly copied wording may generate method correlations and inflate reliability (DeVellis and Thorpe, 2022).
Combine deduction from theory and existing scales with induction from interviews, focus groups, or observation. Each item should address one idea, match language proficiency, specify timing when needed, and avoid experiences unavailable to most respondents. Hinkin (1998) likewise situates item generation within a clear development and psychometric-testing sequence.
- Each dimension has multiple candidate items.
- Items reflect the construct rather than merely a shared topic.
- No pairs differ by only a few words.
- Item specificity matches conceptual specificity.
- Wording suits target respondents.
- Record sources and rights for inherited items.
- Use reversed items only with justification rather than as a trick against mechanical responding.
7. Choose response formats as part of measurement
More response points are not automatically better. Respondents must meaningfully distinguish levels. A midpoint suits genuine neutrality; an even-numbered scale suits necessary directional choice only without misrepresenting genuinely neutral respondents. DeVellis and Thorpe (2022) base midpoint decisions on purpose and question nature, with no universally superior format.
Likert, semantic differential, binary, and visual analog scales yield different information. With multiple collection modes, examine whether identical items and options function equivalently on paper, telephone, and web.
| Format | Suitable when | Warning |
|---|---|---|
| Likert agreement | Measuring endorsement of a clear statement | Prone to acquiescence and wording effects |
| Construct-specific | Trust, usefulness, or satisfaction can be asked directly | Labels must match the construct |
| Semantic differential | Evaluating objects through adjective pairs | Endpoints must genuinely oppose each other |
| Binary | Clear yes/no states | Limited variation; often requires more items |
| Visual analog | Continuous sensitivity and suitable interfaces are needed | Equivalence across devices and users is difficult |
8. Expert review and content-validity evidence
Give experts conceptual definitions and dimension descriptions before item rating. They assess relevance, representativeness, clarity, concision, omissions, and confusion with neighboring concepts. A CVI value cannot replace reasons why items do or do not represent the domain (DeVellis and Thorpe, 2022; Boateng et al., 2018).
Include content experts and measurement-method specialists. Where feasible, involve target-population members to identify overlooked language or experiences. Record final decisions in a disposition table rather than saving disconnected rating files alone.
| Item ID | Intended dimension | Relevance | Clarity | Comment | Decision and reason |
|---|---|---|---|---|---|
| NT1 | Ability | High | Moderate | Technical terminology | Revise using user language |
| NT2 | Ability | Moderate | High | Close to self-confidence | Retain provisionally and assess discrimination |
| NT3 | Integrity | Low | High | Outside the domain | Remove because it does not match the definition |
9. Calculate CVI with explicit denominators, formulas and limits
Under a four-point relevance protocol, ratings of 3 or 4 count as relevant. I-CVI divides the endorsing experts by the experts assessing that item under the protocol: 7 / 8 = .875. S-CVI/Ave averages the I-CVIs; S-CVI/UA is the proportion of items receiving unanimous endorsement. Reporting only S-CVI leaves these different calculations ambiguous (Polit & Beck, 2006).
In the convention discussed by Polit and Beck (2006), three to five experts require item-level unanimity; for six to ten experts, .78 is commonly used. Endorsements are integers: five of six or seven of eight are needed to exceed .78. This is a selected screening convention, not a guarantee of validity. For larger panels or different guidance, identify the applicable source rather than extending a threshold table without justification. For S-CVI/Ave, this source recommends .90 for average relevance; meeting it still requires a substantive content argument.
The constructed example in Figure 2 has four items and eight experts, with endorsement counts of 8, 7, 5 and 8. Their I-CVIs are 1.000, .875, .625 and 1.000; S-CVI/Ave = .875 and S-CVI/UA = .500. The third item warrants review. If it alone represents a subdomain, consider revision or new candidates and obtain fresh evidence rather than automatically removing it (DeVellis & Thorpe, 2022).
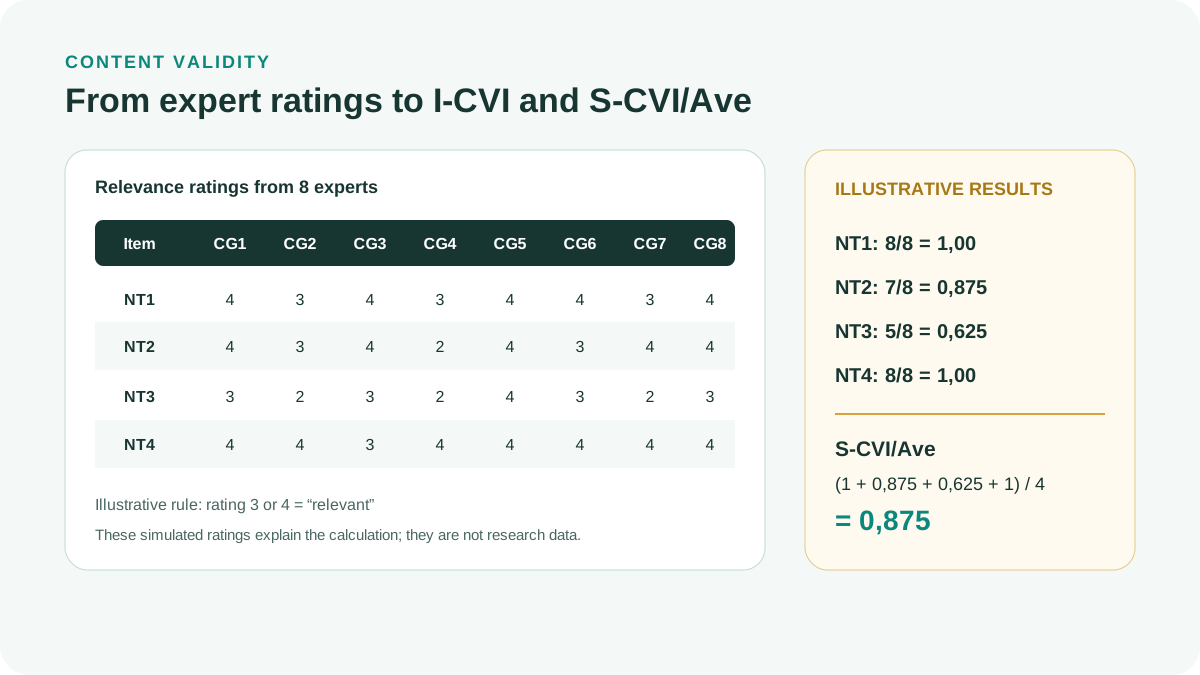
| Quantity | Illustrative result | Interpretation and limit |
|---|---|---|
| S-CVI/Ave | (1 + .875 + .625 + 1) / 4 = .875 | Average relevance; inspect low individual items |
| S-CVI/UA | 2 / 4 = .500 | Two of four items receive unanimous endorsement |
| Clarity and domain coverage | Examine ratings and the domain map separately | A relevance proportion does not establish either |
| Missing ratings or absent reviewers | Record available judgments per item | Do not recode omissions as 1; complete or explain ratings before aggregation |
# Constructed relevance ratings, rows = items, columns = experts.
ratings <- rbind(
  NT1 = c(4,3,4,3,4,4,3,4),
  NT2 = c(4,3,4,2,4,3,4,4),
  NT3 = c(3,2,3,2,4,3,2,3),
  NT4 = c(4,4,3,4,4,4,4,4)
)
stopifnot(!anyNA(ratings), all(ratings %in% 1:4))
relevant <- ratings >= 3
i_cvi <- rowMeans(relevant)
s_cvi_ave <- mean(i_cvi)
s_cvi_ua <- mean(rowSums(relevant) == ncol(ratings))
data.frame(item = rownames(ratings), votes = rowSums(relevant), I_CVI = i_cvi)
c(S_CVI_Ave = s_cvi_ave, S_CVI_UA = s_cvi_ua)
# Expected: 0.875 and 0.500. Complete ratings only; no missing-value rule inferred.
10. Conduct cognitive interviews before a larger pilot
Cognitive interviews ask target-population members to interpret items, describe what they considered, and explain their response-level choices. This is more direct evidence than a general question about understandability. Willis (2005) provides a practical framework for think-aloud and verbal probing.
Not everyone needs every probe for every item. Divide items into groups to reduce burden while ensuring coverage of all items and important respondent groups. The objective is to identify systematic misunderstanding patterns rather than remove every criticized item.
Select participants
Recruit people resembling the target population and covering important language or experience differences.
Prepare a protocol
Include consent, think-aloud, comprehension probes, paraphrasing, recall, judgment, and response mapping.
Test items in context
Use the intended instructions, order, devices, and response options.
Record problems by item
Code misunderstandings, difficult words, missing situations, unsuitable responses, and sensitive reactions.
Make justified revisions
State the problem, change, rationale, and hypothesis about its effect.
Retest
Substantially revised items require another round rather than only rereading by the research team.
11. Plan validation measures before collecting the development sample
Step 6 in DeVellis and Thorpe (2022) considers validation items before collecting the development sample. Candidates include measures of related and distinct constructs, external criteria or response tendencies where justified. They do not automatically become items of the scale being developed.
Prespecify the expected direction, timing and type of score relationship, with a theoretical rationale. Selecting items and evaluating them against a criterion created from those same items provides little independent evidence. Check source, permission and respondent burden for each external measure; do not add numerous scales simply to find a small p-value (DeVellis & Thorpe, 2022).
| Purpose | Candidate external measure | Decisions to record |
|---|---|---|
| Convergence | A sourced measure of the same or a related construct | Expected direction, version and scoring |
| Discrimination | A distinct construct that could be confused with the target | Why separation matters; comparison model |
| Criterion or prediction | An external outcome suited to the intended use | Timing; avoid using the target items as their own criterion |
| Response tendencies | A justified method-related measure | Reason for inclusion; correlation does not itself establish misconduct |
12. Plan development samples for stability, not a mechanical ratio
Samples must belong to the intended population and vary sufficiently on the construct. Excessive homogeneity may make items appear weak because of range restriction. Samples very different from the population may produce structures that do not replicate in actual use (DeVellis and Thorpe, 2022).
No respondent-to-item ratio applies universally. Sample size depends on factor counts, items per factor, communalities, loadings, estimators, categorical data, and complexity. Boateng et al. (2018) describe common rules while recommending sufficiently large samples and independent validation. Justify the intended model through power or precision rather than merely citing a 10:1 rule.
If one sample selects factor counts, removes items, and adds residual correlations before being used to claim confirmatory CFA, confirmation is optimistic. Use independent samples or planned splits when sample size and design permit.
13. Choose Correlations and Estimators According to Data Type
EFA and CFA should not automatically treat all Likert items as continuous. For ordinal items, few categories, or pronounced skewness, polychoric correlations with categorical estimators such as WLSMV are often more appropriate than Pearson correlations and ordinary ML. Flora and Curran (2004) support considering categorical estimation when categories are few and continuous assumptions unreasonable.
With enough categories, modest skewness, and a defensible continuous approximation, ML or robust ML such as MLR may be considered. Neither every Likert item requiring WLSMV nor every 5-point scale allowing ML is a valid universal rule. Consider category counts, distributions, sample size, models, and software implementation. For EFA, Fabrigar et al. (1999) recommend theoretically connected decisions about extraction, factor counts, and rotation.
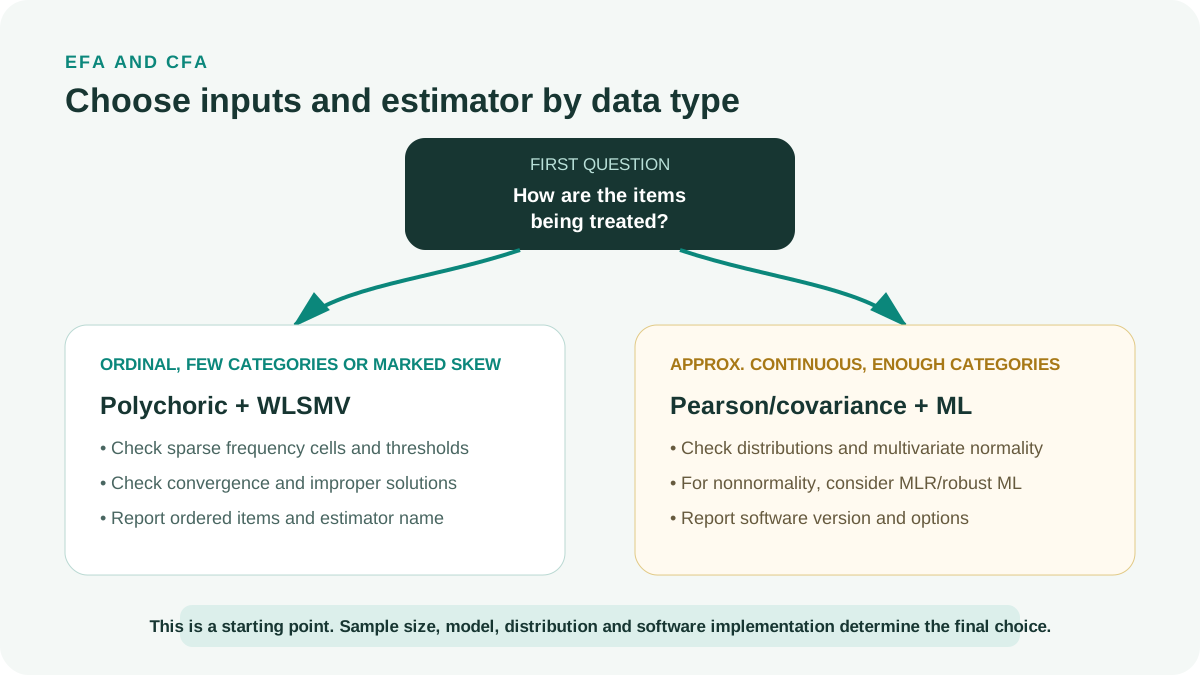
| Data and objective | Correlation or input | Initial estimator | Required checks |
|---|---|---|---|
| Ordinal, few categories, or clear skewness | Polychoric | WLSMV or an equivalent robust categorical estimator | Sparse cells, convergence, thresholds, and specification sensitivity |
| Approximately continuous, enough categories, reasonable distributions | Pearson or covariance | ML | Multivariate normality, improper solutions, and residuals |
| Approximately continuous but nonnormal | Covariance | MLR or equivalent robust ML | Robust standard errors, robust fit indices, and outliers |
| EFA with potentially correlated factors | According to data type | Appropriate extraction | Parallel analysis and oblique rotation |
Mplus commonly uses WLSMV for categorical indicators; lavaan can use WLSMV with ordered items; other software may use similar names or algorithms. Report the actual software, version, variable types, and options.
14. Evaluate items, EFA and CFA as connected decisions
Begin with missingness, distributions, floors/ceilings, item correlations, and corrected item-total correlations. Negative correlations may reflect incorrect reversal, different wording, or different dimensions. Do not remove items merely to increase alpha when they protect important domain content (DeVellis and Thorpe, 2022).
EFA explores dimensionality and loading patterns. CFA tests a specified structure. Clark and Watson (2019) prioritize unidimensionality and construct validity over maximizing internal consistency. High alpha may result from near-duplicate items while important conceptual content remains absent.
Check coding and missing data
Verify score direction, reversed items, out-of-range values, and reasons for missingness.
Read item distributions
Identify floors, ceilings, limited variation, and groups lacking relevant experience.
Read the correlation matrix
Identify isolated items, near-duplicate pairs, and unusual negative correlations.
Run parallel analysis
Combine it with theory to select plausible factor counts rather than using one criterion alone.
Estimate an appropriate EFA
For few-category or skewed ordinal items, consider polychoric correlations and appropriate methods; for approximately continuous data, explicitly identify Pearson, ML, or robust choices. Use oblique rotation when factors may correlate.
Examine loadings and cross-loadings
Consider magnitudes, differences, content, and effects on domain coverage.
Freeze the measurement model
Record retained and removed items, reasons, and structure before CFA.
Conduct independent CFA
Assess the solution, loadings, residuals, fit, and theoretically justified competing models.
Assess reliability
Report appropriate alpha or omega with CIs where available; assess test–retest when scores require stability.
Assess validity evidence
Compare convergent, discriminant, criterion, and predictive relationships against prespecified hypotheses.
15. Lock scoring, reverse coding and missing-response rules
Evidence supporting a structure does not uniquely determine its scoring rule. Item means, sums, CFA factor scores and PLS-SEM construct scores are different calculations. A mean uses equal weights; factor scores depend on the fitted model and scoring method; PLS scores depend on the specification and algorithmic weights. State the calculation, item version and score direction rather than calling every aggregate a latent score (DeVellis & Thorpe, 2022; SmartPLS, n.d.).
This constructed example only demonstrates scoring three items of a hypothetical subscale; it does not establish unidimensionality. For responses from 1 to 5, Q2R is reversed as 6 minus its original response. Compare requiring all three items with allowing at least two. The two-of-three policy is an example assumption, not a general cutoff. Do not turn not applicable into a neutral response; permitted missingness must follow the manual or a justified protocol.
| Hypothetical respondent | Q1; original Q2R; Q3 | All-three mean | At-least-two mean |
|---|---|---|---|
| A | 4; 2; 5 | 4.3333… | 4.3333… |
| B | 3; 1; 4 | 4.0000 | 4.0000 |
| C | 5; 3; missing | Not scored | 4.0000 |
| D | missing; 2; 3 | Not scored | 3.5000 |
| E | 2; missing; 2 | Not scored | 2.0000 |
# Constructed teaching data, not an estimated measurement model.
raw <- data.frame(Q1=c(4,3,5,NA,2), Q2R=c(2,1,3,2,NA), Q3=c(5,4,NA,3,2))
items <- raw
items$Q2R <- 6 - raw$Q2R  # Reverse once; retain the raw values.
n_valid <- rowSums(!is.na(items))
mean_complete <- ifelse(n_valid == 3, rowMeans(items), NA_real_)
mean_min2 <- ifelse(n_valid >= 2, rowMeans(items, na.rm=TRUE), NA_real_)
data.frame(n_valid, mean_complete, mean_min2)
# The two-of-three rule is illustrative, not a universal scoring recommendation.
16. Hypothetical Example: Developing Trust in Methodological Advisors
The following example is illustrative; all values were created to demonstrate decisions. The team defines trust through ability, integrity, and benevolence. Theory and qualitative interviews generate 27 items. Expert review retains 22; cognitive interviews revise 6 and remove 2 double-barreled items. The pilot contains 20 items.
EFA in a hypothetical development sample suggests three factors. Two items have similar cross-loadings, but one uniquely covers benevolence content. The team retains that item for revision and retesting rather than immediate deletion. CFA in a hypothetical independent sample gives the revised item a loading of 0,67. The three-factor model outperforms the one-factor model. Describe this as initial support for a three-dimensional structure rather than permanent proof of scale correctness.
| Stage | Item count | Finding | Decision |
|---|---|---|---|
| Item pool | 27 | All three dimensions covered; some near-duplicate wording | Submit the entire pool for review |
| Expert review | 22 | Three outside-domain items and two duplicates | Remove on substantive grounds |
| Cognitive interview | 20 | Six unclear questions, two double-barreled questions | Revise six, remove two |
| Hypothetical EFA | 15 | Three factors; one item protects domain content | Retain after rewriting |
| Hypothetical CFA | 15 | Three-factor model outperforms one-factor model | Treat as initial confirmation |
17. Read reliability and validity as accumulating evidence
Reliability is necessary but insufficient for validity. Alpha or omega indicate consistency under a model and dataset rather than whether the intended concept is measured. Very high values may indicate duplicated content; low values may reflect multidimensionality, few items, range restriction, or substantial error (DeVellis and Thorpe, 2022).
Validity is an argument about score interpretation and use. Prespecify hypotheses relating scores to similar variables, distinct variables, and external criteria. Boateng et al. (2018) and Clark and Watson (2019) treat dimensional confirmation, reliability, and theoretically grounded relational networks as complementary rather than interchangeable.
| Evidence | Question | Example analysis |
|---|---|---|
| Content | Do items adequately and comprehensively represent the domain? | Domain maps, expert review, cognitive interviews |
| Internal structure | Do dimensionality and item patterns fit? | EFA, CFA, competing models |
| Reliability | Are scores sufficiently precise and stable for their purpose? | Omega or alpha, test–retest, CIs |
| Relations with other variables | Does the relationship pattern match theory? | Convergent, discriminant, criterion, predictive |
| Generalization | Are results stable across groups and time? | Cross-validation and measurement invariance |
18. Ten Errors That Produce Attractive but Hard-to-Defend Scales
| Error | Consequence | Correction |
|---|---|---|
| Starting with items without a definition | The domain follows the data | Finalize definitions and domain maps first |
| Creating a scale despite an appropriate existing instrument | Loss of comparability | Review existing instruments and explain the gap |
| Using only content experts | Measurement and wording problems are overlooked | Combine content, methods, and user perspectives |
| No cognitive interviews | Item interpretation remains unknown | Pretest with population members |
| Using alpha to decide every item | Sacrifices content validity | Consider content, structure, and reliability together |
| Calling PCA EFA | Incorrect factor-model logic | Name the actual method and estimator |
| Using only eigenvalues above 1 | Unstable factor counts | Combine parallel analysis with theory |
| EFA and CFA using the same sample | Optimistic confirmation | Independent samples or planned sample splits |
| Removing items without documenting reasons | Not reproducible; domain coverage is difficult to assess | Maintain a disposition log |
| Declaring the scale valid | Turns contextual evidence into an absolute property | State evidence types, sample, context, and limitations |
19. APA 7 Reporting Template and Prepublication Checklist
Methods should identify item sources, rights, generation or translation, expert composition, I-CVI and S-CVI calculations, cognitive-interview procedures, stage-specific samples, variable types, correlations, estimators, and decision criteria. Hinkin (1998) notes that weak measurement undermines interpretation of relationships in field research; scale development should not be reduced to stating that Cronbach’s alpha was checked.
Appendices should preserve all trial and final items, instructions, response scales, coding, disposition logs, and item-to-domain matrices. If copyright prevents item publication, still describe procedures sufficiently and direct readers to legitimate sources.
Example report
The [name] scale was [developed/adapted] to measure [definition] in [population and context]. The initial pool contained [ ] items generated from [theory, existing scales, and qualitative data]. [Number and composition] experts rated relevance on a [ ] scale; I-CVI ranged from [ ] to [ ] and S-CVI/Ave = [ ]; [number] cognitive-interview rounds involved [participant characteristics]. EFA in development sample N = [ ] used [polychoric/Pearson], [estimator or extraction], and [rotation], alongside parallel analysis, yielding [number] factors with [number] items. CFA in independent sample N = [ ] used [WLSMV/ML/MLR] to test structure [ ], with standardized loadings from [ ] to [ ] and fit [indices]. Reliability was estimated using [omega/alpha/test–retest] = [ ], with [CIs if available]. Validity evidence was assessed through [hypotheses and results]. Conclusions are limited to [population, language, and score purpose]. State whether the instrument is reflective or formative, the external validation measures, scoring method [mean/sum/model-based score], reversed items [ ], minimum responses for scoring [ ] and treatment of inapplicable responses. Archive the item and codebook version with the evidence.
- Explain why development or adaptation is necessary.
- Provide sourced definitions, dimensions, and conceptual boundaries.
- The item pool covers the domain and records each item’s source.
- Expert reviews specify rating levels, I-CVI formulas, correctly named S-CVI indices, and qualitative comments.
- Cognitive interviews involve the intended population and revision rounds.
- Describe a relevant, sufficiently diverse development sample.
- Match EFA correlations, estimators/extraction, and rotation to data types.
- Do not decide factor counts using one cutoff.
- Give substantive and statistical reasons for every removed item.
- CFA uses information independent of exploration.
- Reliability suits the purpose and does not replace validity.
- Convergent, discriminant, and criterion evidence follows hypotheses.
- Consider measurement invariance for group comparisons.
- Avoid claiming the scale has been proved completely valid.
- Version item files, codebooks, and disposition logs.
Conclusion
Scale development is a program of accumulating evidence rather than one EFA followed by CFA. Sound decisions simultaneously protect the concept, respondent experience, and data structure.
If shortening is necessary, remove items only after understanding which domain content will be lost. A short scale measuring the wrong concept or omitting content is not improved merely because alpha rises.
References
- Boateng, G. O., Neilands, T. B., Frongillo, E. A., Melgar-Quiñonez, H. R., & Young, S. L. (2018). Best practices for developing and validating scales for health, social, and behavioral research: A primer. Frontiers in Public Health, 6, Article 149. https://doi.org/10.3389/fpubh.2018.00149
- Clark, L. A., & Watson, D. (2019). Constructing validity: New developments in creating objective measuring instruments. Psychological Assessment, 31(12), 1412-1427. https://doi.org/10.1037/pas0000626
- DeVellis, R. F., & Thorpe, C. T. (2022). Scale development: Theory and applications (5th ed.). SAGE Publications. https://us2.sagepub.com/en-us/nam/scale-development/book269114
- Fabrigar, L. R., Wegener, D. T., MacCallum, R. C., & Strahan, E. J. (1999). Evaluating the use of exploratory factor analysis in psychological research. Psychological Methods, 4(3), 272-299. https://doi.org/10.1037/1082-989X.4.3.272
- Flora, D. B., & Curran, P. J. (2004). An empirical evaluation of alternative methods of estimation for confirmatory factor analysis with ordinal data. Psychological Methods, 9(4), 466-491. https://doi.org/10.1037/1082-989X.9.4.466
- Hinkin, T. R. (1998). A brief tutorial on the development of measures for use in survey questionnaires. Organizational Research Methods, 1(1), 104-121. https://doi.org/10.1177/109442819800100106
- Polit, D. F., & Beck, C. T. (2006). The content validity index: Are you sure you know what is being reported? Critique and recommendations. Research in Nursing & Health, 29(5), 489-497. https://doi.org/10.1002/nur.20147
- Willis, G. B. (2005). Cognitive interviewing: A tool for improving questionnaire design. SAGE Publications. https://us.sagepub.com/en-us/nam/cognitive-interviewing/book225856
- DeVellis, R. F. (2017). Scale development: Theory and applications (4th ed.). SAGE. https://in.sagepub.com/en-in/ind/scale-development/book246123
- SmartPLS. (n.d.). PLS-SEM algorithm. https://smartpls.com/documentation/algorithms-and-techniques/core-algorithm/pls/
Academic note: Example values are hypothetical. Scales supporting high-consequence individual decisions require stricter reliability, precision, fairness, and external-validation standards than group-level research scales.