
EFA of Likert Data Using SPSS, R, and FACTOR: A Reproducible Workflow
SPSS is convenient for Pearson-based EFA, but few-category or strongly skewed Likert data may require polychoric correlations and ordinal parallel analysis. This guide places three programs within one decision workflow.
Choose among SPSS, R and FACTOR; inspect data, select correlations, determine factor count, extract and rotate, address warnings, compare sensitivity solutions and report reproducibly.
1. Objectives and input data
This workflow explores scale structure from Likert items. Use rectangular data with respondents in rows and items in columns; the codebook must identify reversed items, missing values and valid ranges.
EFA does not replace theory. Map each item to its expected construct and content domain before analysis. Software examines column relationships without knowing substantive importance (Fabrigar & Wegener, 2012; Finch et al., 2016).
- Provide a codebook and reverse-coding rules.
- Give each item a brief content label.
- Identify ordinal or approximately continuous treatment.
- Reserve CFA data or plan independent confirmation.
- Do not combine unrelated instruments merely because they share a file.
2. Software decision map
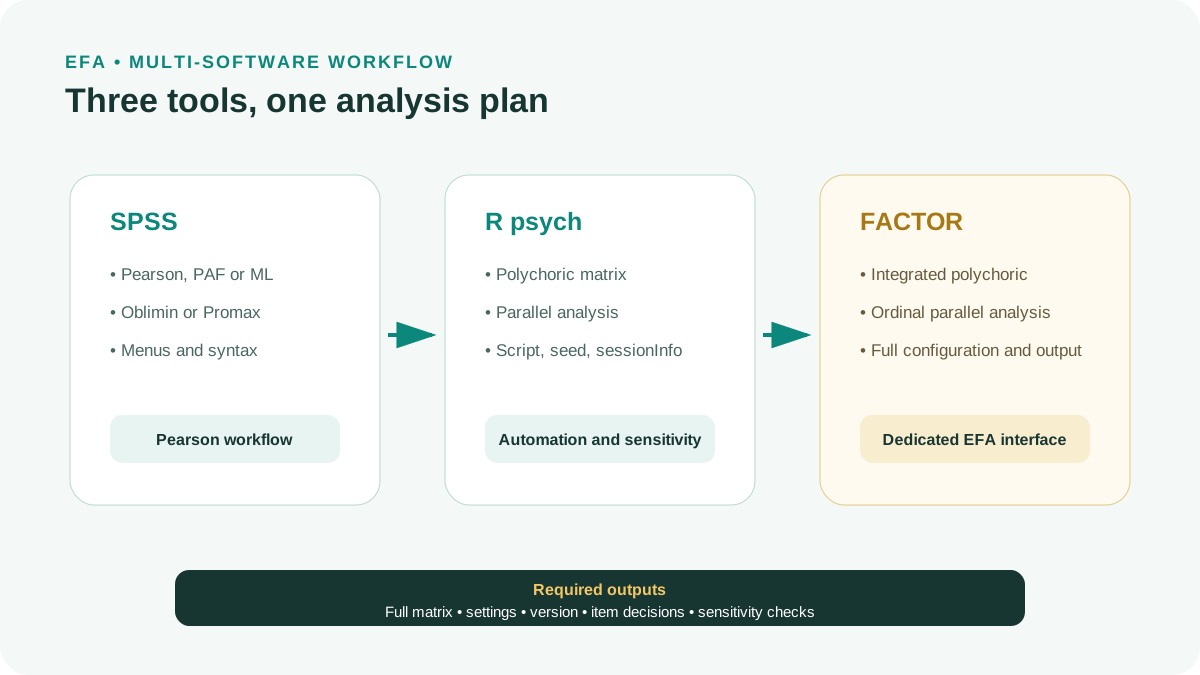
No program is best for every situation. SPSS suits Pearson, PAF and oblique rotation; R supports automation and specification comparisons; FACTOR offers polychoric correlations and parallel analysis in a dedicated EFA tool (Lorenzo-Seva & Ferrando, 2006).
| Need | SPSS | R psych | FACTOR |
|---|---|---|---|
| Menu-based Pearson EFA | Very suitable | Available | Available |
| Polychoric | Not in the default FACTOR dialog | Yes | Yes |
| Parallel analysis ordinal | Requires an additional workflow | Yes | Yes |
| Reproducible scripting | Syntax | R script | Configuration and output files |
| Beginners with little coding experience | Easy | Requires learning commands | Accessible interface |
3. Step 1: clean and check coding
Tabulate each item. Find out-of-range values, zero-variance variables, unreversed items, sparse categories and numeric missing codes such as 99. Unreversed items can generate negative loadings or artificial factors.
Specify missing-data treatment before EFA. Listwise deletion reduces N and can change sample composition. Do not automatically mean-impute each item because variance and correlations can shrink.
- All item responses lie within valid ranges.
- Reverse-coding formulas are documented.
- Missing codes are not treated as responses.
- Record the remaining sample size.
- Check almost identically worded pairs.
4. Step 2: choose Pearson or polychoric correlations
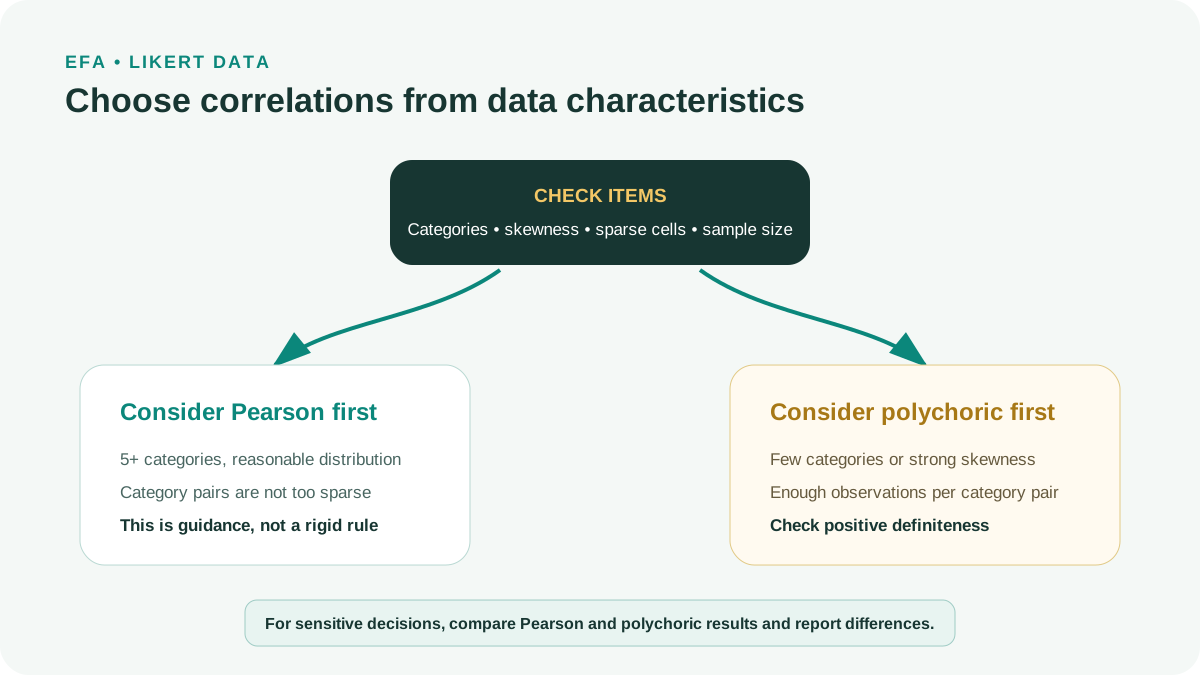
Pearson may be defensible with at least five categories, moderate distributions and reasonably populated response pairs (Rhemtulla et al., 2012). Polychoric correlations model continuous latent variables categorized into ordinal responses; consider them with fewer or concentrated categories (Flora & Curran, 2004; Watkins, 2018).
Polychoric is not automatically superior. With small N and many 0 cross-tabulation cells, estimates can be unstable or the matrix non-positive-definite. Comparing Pearson and polychoric sensitivity is often more useful than one slogan for all Likert data.
| Signal | Priority consideration | Caution |
|---|---|---|
| 5-7 categories, reasonably balanced distributions | Pearson | Still assess sensitivity for consequential decisions |
| 2-4 categories or strong skewness | Polychoric | Requires enough observations in category pairs |
| Many empty cells | Justified category collapsing or increased sample | Do not collapse merely to force estimation |
| Solutions differ across matrices | Report both | Do not select the favorable result without explanation |
5. Step 3: parallel analysis for factor retention
Do not rely only on eigenvalue > 1. Parallel analysis compares observed eigenvalues with random-data distributions. MAP and scree add evidence; final factors must remain interpretable with enough quality items (O'Connor, 2000; Watkins, 2018).
For ordinal data, use parallel analysis appropriate to the polychoric matrix. Garrido et al. (2013) demonstrate ordinal influences on retention. Record reference-data generation, repetitions and percentiles where supported.
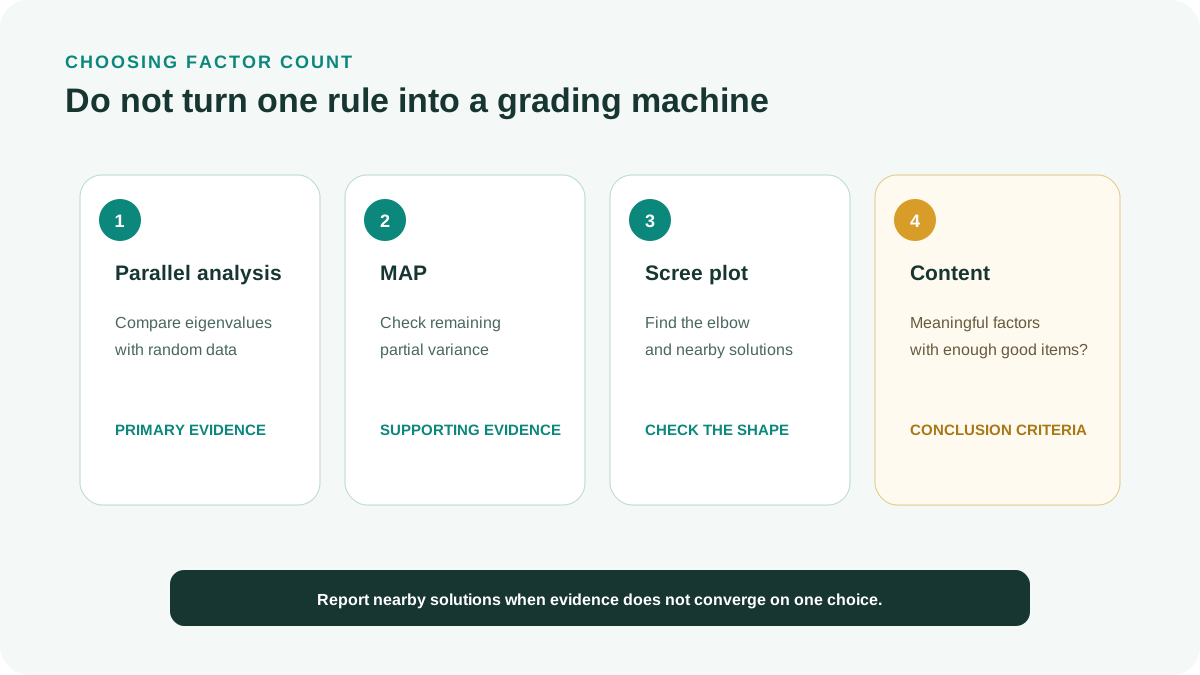
Comparing neighboring solutions is valid when transparent. Trying many and reporting only the most attractive introduces favorable post-data selection.
6. Step 4A: EFA in SPSS
IBM describes PAF, ML and oblique rotations in Factor, but FACTOR defaults to PCA and Varimax unless specified otherwise (IBM, n.d.). Do not simply accept every default.
Open Factor
Choose Analyze > Dimension Reduction > Factor and add shared-domain items to Variables.
Select Descriptives
Request KMO and Bartlett, anti-image and reproduced correlations.
Select Extraction
Change Principal Components to Principal Axis Factoring and request a scree plot.
Enter the factor count
Set Fixed number of factors from parallel analysis and theory.
Select Rotation
Use Direct Oblimin or Promax when factors may correlate.
Inspect all relevant output
Read communalities, pattern, structure, factor correlations and residuals.
Save syntax
Choose Paste before Run to preserve a reproducible specification.
7. Step 4B: ordinal EFA in R
A minimal workflow reads data, selects items, checks frequencies, computes polychoric correlations, runs parallel analysis and fits fa with the chosen factor count. Set a seed for simulation and preserve sessionInfo to document R/package versions.
Function names can change. psych documents polychoric, fa.parallel and fa; consult help for your installed version rather than copying unchecked code (Revelle, 2026).
Reporting example in English
items <- dat[c('q1','q2','q3','q4','q5','q6')] poly <- psych::polychoric(items)$rho set.seed(20261023) psych::fa.parallel(poly, n.obs = nrow(items), fa = 'fa') fit <- psych::fa(poly, nfactors = 2, n.obs = nrow(items), fm = 'minres', rotate = 'oblimin') print(fit$loadings, cutoff = 0) fit$Phi
8. Step 4C: EFA in FACTOR
Import data and identify ordinal items. Select polychoric correlations, parallel analysis and a common-factor estimator. Use oblique rotation for related constructs. Export full output and configuration rather than just a loading screenshot.
FACTOR brings procedures such as polychoric correlations and parallel analysis into practical EFA (Lorenzo-Seva & Ferrando, 2006). Check the current manual because menus can change.
- Use correct decimal and missing-value formats.
- Specify each item’s category count.
- Match parallel analysis to the data type.
- Record estimator and rotation.
- Investigate matrix or Heywood warnings.
9. Step 5: read output in a consistent order
Inspect factor count and convergence first, then communalities, pattern, factor correlations and residuals. With oblique rotation, structure does not replace pattern because it also reflects factor correlations (Finch et al., 2016).
Name factors from shared content across strong items, not one standout item. A factor dominated by reversed or similarly worded items may reflect a method effect.
| Table | Question | Signal to investigate |
|---|---|---|
| Parallel analysis | How many factors? | Borderline or theoretically inconsistent solution |
| Communalities | How much item variance is explained? | Many very low communalities |
| Pattern matrix | Which factor uniquely relates to each item? | Low loadings or cross-loadings |
| Factor correlations | How distinct are factors? | Excessive correlations |
| Residuals | How well are correlations reproduced? | Many large residuals |
10. Step 6: warnings and improper solutions
| Warning | Possible cause | Action |
|---|---|---|
| Correlation matrix not positive definite | Duplicate items, unstable polychoric estimates or sparse cells | Inspect eigenvalues, item pairs and frequencies |
| Heywood case | Communality > 1 or negative uniqueness | Review factors, items, estimator and N |
| Nonconvergence | Excessive complexity or weak data | Justify simplification rather than only increasing iterations |
| Factor with 1-2 items | Insufficient substantive identification | Develop items or reconsider factor count |
| Sign-reversed solution | Factor sign indeterminacy | A complete sign reversal need not change meaning |
11. Step 7: sensitivity across specifications
Prespecify primary and sensitivity analyses. For example, primary polychoric/MINRES/oblimin versus sensitivity Pearson/PAF/Promax. Compare factors, item membership, primary loadings and factor correlations.
Similar structures strengthen stability. Investigate differences through skewed items, sparse cells or estimators. Sensitivity is not unlimited searching for the desired result.
Choose the primary analysis from the data type before estimation. Sensitivity examines assumption dependence. The decision rule identifies differences that would change conclusions.
12. Hypothetical example: three programs, one decision
These values are illustrative. A set of 15 four-category Likert items has N = 360, with four strongly skewed items. Pearson parallel analysis suggests four factors, polychoric suggests three, and scree/content support three.
SPSS Pearson/PAF/Promax gives Q09 loadings 0.41 on F2 and 0.38 on F3. R and FACTOR polychoric give Q09 loadings 0.52 on F2 and 0.20 on F3. Item review suggests rare responses attenuate Pearson correlations. The primary ordinal analysis retains Q09 and reports the sensitivity finding.
| Specification | Factor count | Q09 | Decision |
|---|---|---|---|
| SPSS Pearson, PAF, Promax | 4 from Pearson PA; also compare 3 | 0,41 / 0,38 | Sensitive to correlation matrix |
| R polychoric, MINRES, oblimin | 3 | 0,52 / 0,20 | Retain in primary analysis |
| FACTOR polychoric | 3 | Close to R solution | Supports reproducibility |
13. Eight common mistakes
| Mistake | Consequence | Correction |
|---|---|---|
| Accepting SPSS defaults | Unintended PCA and Varimax | Specify PAF/ML and rotation |
| Using only KMO/Bartlett | Cannot determine factor count | Add PA, MAP, scree and theory |
| Treating every Likert item as continuous | Ignores ordinal measurement and skewness | Inspect categories, distributions and sparsity |
| Unchecked polychoric estimation | Unstable matrix | Inspect warnings and sensitivity |
| Hiding small loadings | Conceals cross-loadings | Preserve the complete matrix |
| Saving only screenshots | Not reproducible | Save syntax, scripts, configurations and versions |
| Deleting many items together | Cannot identify what changed the solution | One item per iteration |
| CFA immediately on the same sample | Overoptimistic fit | Reserve confirmation data |
14. APA 7 reporting template and checklist
Reporting example in English
EFA analyzed [n] observations and [p] [category-count] items. Primary analysis used [Pearson/polychoric], [estimator/extraction] and [rotation]. Factors were retained using parallel analysis [details], scree and content. Sensitivity analysis with [specification] yielded [similar/different] results. Final pattern loadings were [range], communalities [range] and factor correlations [range]. Analyses used [software/version]; scripts and output were stored at [ ].
- Describe coding and missing-data treatment.
- Report item categories and distributions.
- Identify Pearson or polychoric correlations.
- Report software and versions.
- Describe parallel analysis and settings.
- State estimator or extraction.
- State rotation.
- Report the full pattern matrix.
- Report factor correlations.
- Describe warnings and responses.
- Distinguish primary and sensitivity analyses.
- Record removed or rewritten items.
- Do not make cutoffs absolute rules.
- Save syntax, seed and session information.
- Use CFA or independent data for confirmation.
Conclusion
The important differences concern correlations, retention and reproducibility rather than software logos. SPSS, R and FACTOR complement each other when following a prespecified plan.
Let Likert data characteristics determine the primary analysis and use sensitivity to assess conclusions. Do not choose software or solutions merely for attractive loadings.
References
- Fabrigar, L. R., & Wegener, D. T. (2012). Exploratory factor analysis. Oxford University Press.https://doi.org/10.1093/acprof:osobl/9780199734177.001.0001
- Finch, W. H., Immekus, J. C., & French, B. F. (2016). Applied psychometrics using SPSS and AMOS. Information Age Publishing.https://www.infoagepub.com/products/Applied-Psychometrics-using-SPSS-and-AMOS
- Flora, D. B., & Curran, P. J. (2004). An empirical evaluation of alternative methods of estimation for confirmatory factor analysis with ordinal data. Psychological Methods, 9(4), 466-491.https://doi.org/10.1037/1082-989X.9.4.466
- Garrido, L. E., Abad, F. J., & Ponsoda, V. (2013). A new look at Horn's parallel analysis with ordinal variables. Psychological Methods, 18(4), 454-474.https://doi.org/10.1037/a0030005
- IBM. (n.d.). Factor analysis extraction.https://www.ibm.com/docs/en/spss-statistics/31.0.0?topic=analysis-factor-extraction
- Lorenzo-Seva, U., & Ferrando, P. J. (2006). FACTOR: A computer program to fit the exploratory factor analysis model. Behavior Research Methods, 38, 88-91.https://doi.org/10.3758/BF03192753
- O'Connor, B. P. (2000). SPSS and SAS programs for determining the number of components using parallel analysis and Velicer's MAP test. Behavior Research Methods, Instruments, & Computers, 32(3), 396-402.https://doi.org/10.3758/BF03200807
- Revelle, W. (2026). psych: Procedures for psychological, psychometric, and personality research.https://cran.r-project.org/package=psych
- Rhemtulla, M., Brosseau-Liard, P. É., & Savalei, V. (2012). When can categorical variables be treated as continuous? A comparison of robust continuous and categorical SEM estimation methods under suboptimal conditions. Psychological Methods, 17(3), 354-373.https://doi.org/10.1037/a0029315
- Watkins, M. W. (2018). Exploratory factor analysis: A guide to best practice. Journal of Black Psychology, 44(3), 219-246.https://doi.org/10.1177/0095798418771807
Methodological note: Menus and defaults can change between versions. Consult the current manual and preserve complete settings for reproduction.