
Cronbach’s Alpha and EFA in PLS-SEM Pilot Tests: How Should They Be Used?
A pilot is not a miniature main study. Cronbach’s Alpha and EFA are useful only when they answer the right questions and the data can support the conclusions.
Use pilots to detect content, operational and data problems. Conduct EFA only for a genuine structural-exploration objective with enough data for a stable solution. In the main PLS-SEM analysis, assess measurement according to construct specification rather than treating Alpha or EFA as permission to proceed.
1. What should a pilot test answer?
Piloting examines a questionnaire before the main study. It reveals confusing questions, faulty skip logic, excessive completion time, unsuitable options, design-induced missingness and data-entry/export problems. These findings often matter more than an attractive Alpha.
Alpha and EFA answer narrower questions. Alpha describes one aspect of score reliability under specific assumptions. EFA explores dimensions and item–common-factor relationships. Neither establishes content validity, repairs ambiguous wording nor replaces cognitive interviews.
Separate cognitive piloting of understanding, operational piloting of the collection process, and statistical piloting of initial data. Match sample size, criteria and conclusions to the relevant layer.
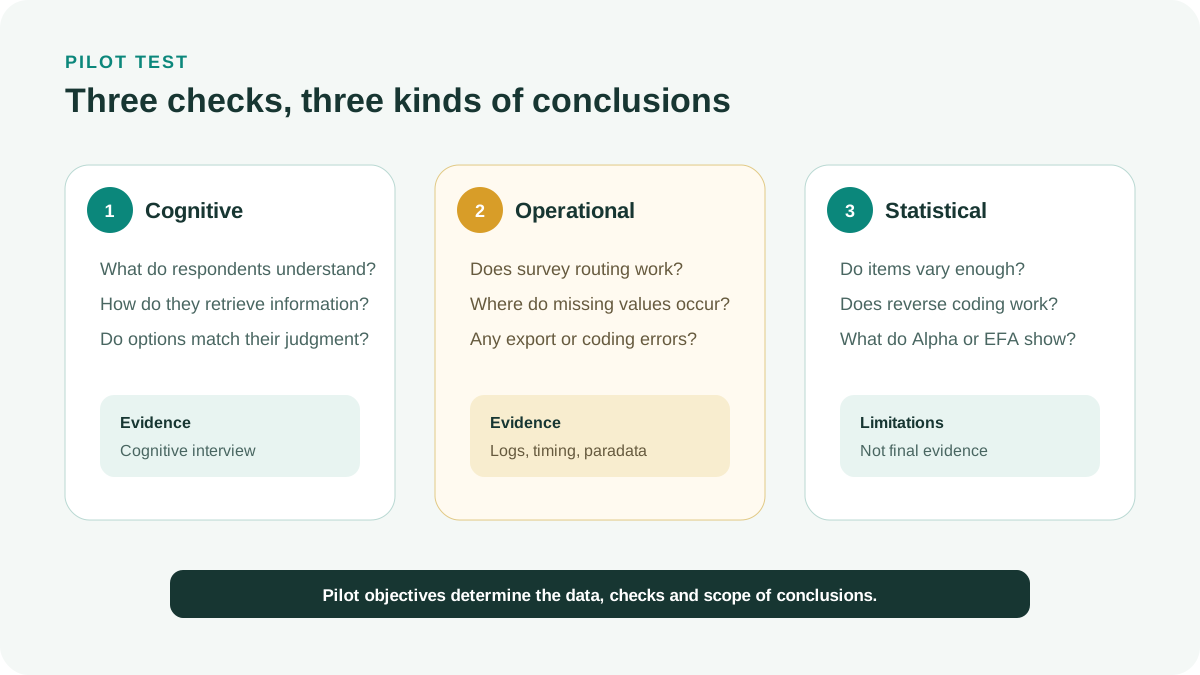
| Pilot layer | Main question | Suitable evidence | Do not conclude |
|---|---|---|---|
| Cognitive | How do respondents understand, retrieve and select responses? | Cognitive interviews, observation and open feedback | Factor structure is stable |
| Operational | Does the survey work from start to finish? | Missingness, timing, skip logic and export errors | The scale has high reliability |
| Statistical | What problems appear in initial data? | Item distributions, correlations, Alpha and EFA when justified | Results will certainly replicate in the main sample |
2. What does Cronbach’s Alpha measure?
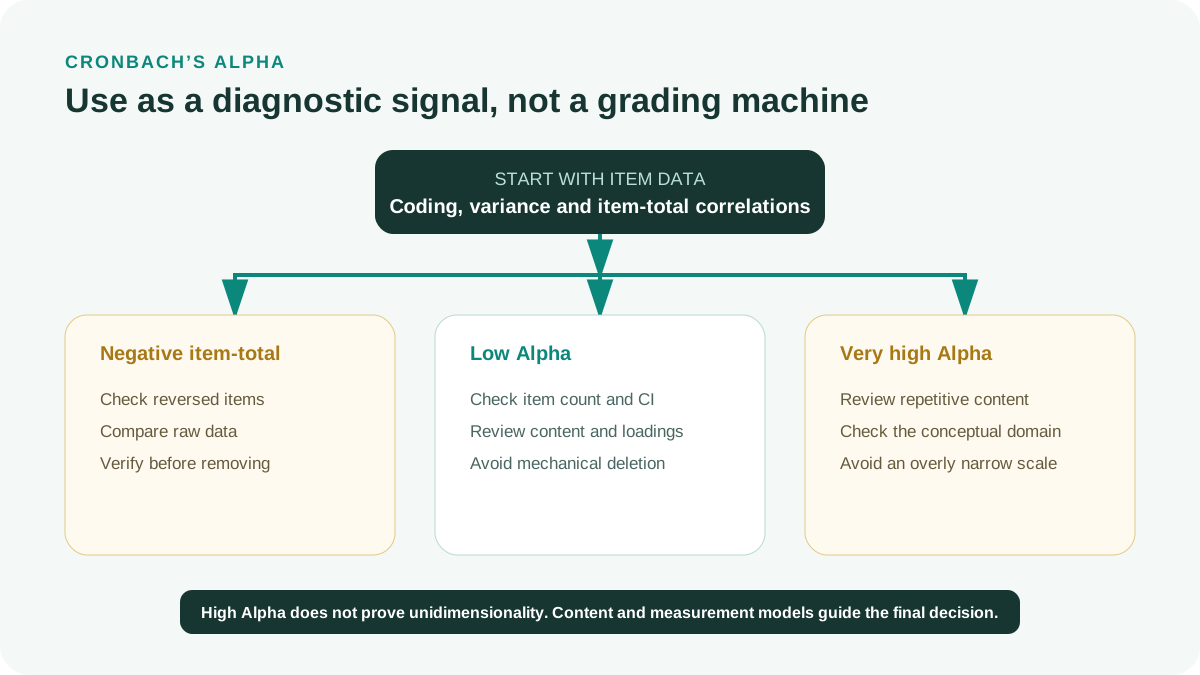
Cronbach (1951) derived Alpha from item covariances. It depends on item count, correlations and score construction. High Alpha does not establish unidimensionality: multidimensional items can produce high values, especially with many or repetitive items.
Alpha is not optimal for every measurement model. Sijtsma (2009) describes limitations of using it as default reliability/internal-consistency evidence. Factor-based omega is another family whose formula and assumptions must be specified (McDonald, 1999). PLS-SEM often reports Alpha with rho_A and composite reliability rho_C, which use different assumptions and estimation approaches (Dijkstra & Henseler, 2015; Hair et al., 2022).
A range of 0.70 to 0.95 is often referenced in applied PLS-SEM (Hair et al., 2022), but is not an automatic grading system. Interpret low values with item count, content, outer loadings and precision. Very high values can indicate redundancy. Alpha ≤ rho_A ≤ rho_C is a common practical expectation, not a law for every sample.
| Measure | Meaning | Cautious use |
|---|---|---|
| Cronbach’s Alpha | Item covariance with restrictive assumptions | Traditional evidence, not proof of unidimensionality |
| rho_A | Reliability estimation suited to the PLS framework | Interpret with Alpha, rho_C and CIs where available |
| rho_C | Composite reliability using estimated outer loadings | Do not retain weak items solely for an overall cutoff |
| Omega or model-based reliability | Depends on factor model and specification | Name the coefficient, software and estimator precisely |
A slight Alpha increase may sacrifice domain coverage and validity. Examine content, coding direction, corrected item-total correlations, inter-item associations and the intended measurement model first.
3. When is pilot-stage EFA appropriate?
EFA suits uncertain dimensionality: new measures, substantial translation/adaptation, major item rewriting or competing theoretical structures. It is not automatically required for clearly validated measures in closely comparable settings.
Do not assume 30 to 50 observations suffice for EFA. MacCallum et al. (1999) link stability to communalities, overdetermination, loadings, factors and model quality. A tidy small-sample solution may change sharply with more data.
If stable EFA cannot be defended, use the pilot to improve the questionnaire and inspect data. Move EFA to a larger development sample or a planned main-sample subset with independent confirmation. Do not call a small pilot solution final structural evidence.
For latent variables explaining item covariance, choose common-factor extraction such as PAF or ML under suitable assumptions. PCA reduces dimensions and is not identical to EFA.
4. Configure EFA for data and theory
Fabrigar et al. (1999) treat extraction, retention and rotation as linked decisions. Eigenvalue > 1 should not stand alone. Combine Horn’s (1965) parallel analysis with scree, interpretability and theory.
Social constructs often correlate, making oblimin or promax more plausible than forced orthogonality. Consider polychoric correlations for few-category or clearly skewed Likert data. Holgado–Tello et al. (2010) show that Pearson versus polychoric choice affects ordinal factor recovery. Report software and settings.
Interpret loadings, cross-loadings and communalities with content. A cutoff cannot replace measurement judgment. A moderate-loading item covering an essential aspect may need revision and retesting rather than immediate deletion.
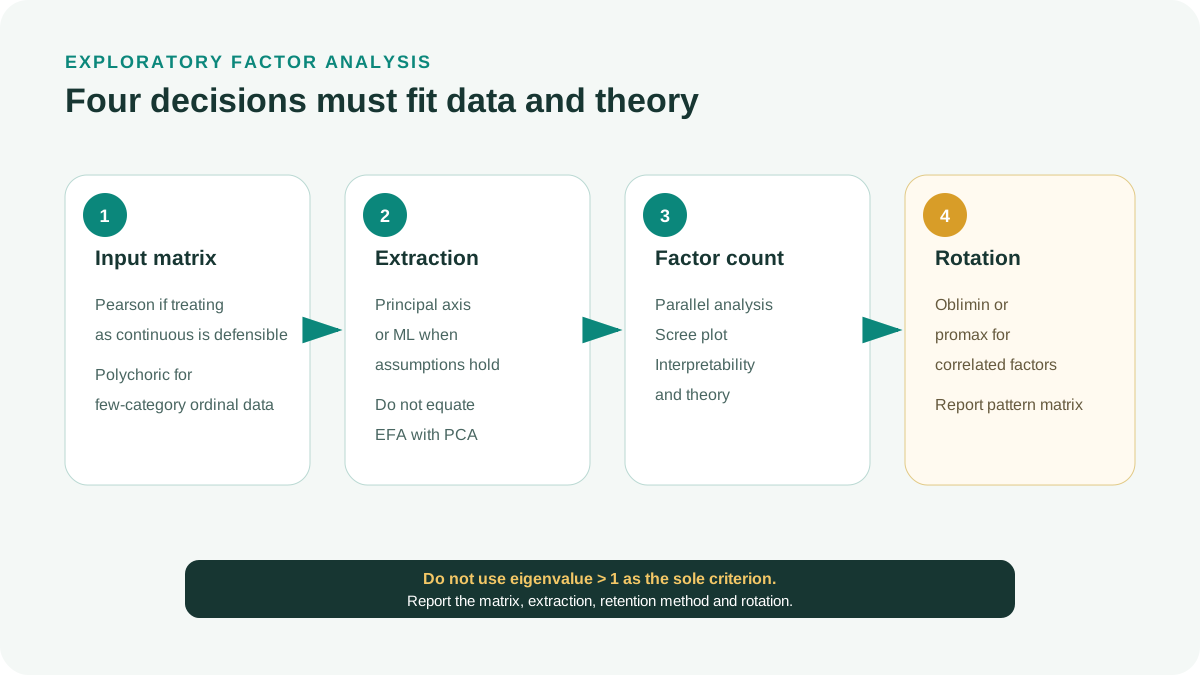
Inspect data
Confirm coding, reversed items, missingness, distributions and categories actually used.
Choose the input matrix
Use Pearson for defensibly approximately continuous items; consider polychoric for few-category or skewed ordinal items.
Choose extraction
Use PAF or ML for common factors under suitable assumptions.
Select factor count
Combine parallel analysis, scree, theory and interpretability.
Rotate
Prefer oblique rotation when factors may relate.
Maintain a decision log
Document retained, revised and removed items with content/statistical reasons.
5. Does CFA conflict with PLS-SEM?
CFA is not required before every PLS-SEM analysis, but saying it is incompatible is too broad. CFA tests common-factor models and suits theoretically specified factors when evaluating that specification.
Traditional PLS-SEM creates composite scores. Composite/emergent constructs require corresponding specification and evaluation. For common factors, justify the estimator and consider consistent PLS or suitable factor methods. Hair and Sarstedt (2019) start factor/composite choice from conceptual formation rather than familiar software.
Do not run CFA simply because a checklist requires it, or reject it because the final analysis uses SmartPLS. Specify construct nature first, then choose measurement and estimation.
| Question | Common factor | Composite |
|---|---|---|
| Construct–indicator relationship | Common factor explains indicator covariance | Weighted indicators form the construct |
| Appropriate confirmatory approach | Factor CFA/SEM; PLSc where suitable | Composite models with corresponding fit/quality assessment |
| Risk of a mismatch | Estimation and interpretation do not match measurement | Assigning factor meaning to a composite score |
6. Assess measurement in PLS-SEM
After finalizing the questionnaire and collecting main data, assess measurement before structure. Reflective assessment typically examines loadings, Alpha, rho_A, rho_C, AVE and HTMT. SmartPLS also recommends bootstrap HTMT CIs rather than Fornell-Larcker alone.
Outer loadings around 0.708, AVE from 0.50 and reliability from 0.70 are common PLS-SEM anchors (Hair et al., 2022). Apply them with objectives, development stage and content validity. Do not automatically delete loadings from 0.40 to below 0.708; examine improvements in AVE/reliability against domain loss.
HTMT 0.85 and 0.90 are reference points depending on conceptual proximity. Stronger reporting gives estimates and bootstrap CIs. SmartPLS currently uses 10,000 subsamples for final results and recommends fixed seeds for reproduction; smaller runs may support preliminary checks (SmartPLS, n.d.).
| Component | Common measures | Question |
|---|---|---|
| Indicator reliability | Outer loading and CI | Does the item stably represent its construct? |
| Internal consistency | Alpha, rho_A, rho_C | Are scores consistent enough for the research purpose? |
| Convergent validity | AVE | Does the construct explain sufficient indicator variance? |
| Discriminant validity | HTMT and bootstrap CIs | Are constructs empirically distinct? |
7. CCA in PLS-SEM: identify the approach
Hair, Howard and Nitzl (2020) use confirmatory composite analysis for a PLS-SEM measurement-quality assessment covering loadings, reliability, convergent/discriminant validity and prediction.
Schuberth (2021) uses CCA more narrowly for SEM testing of composite models through discrepancies between observed and implied matrices, often bootstrap-based. The same name therefore does not identify an identical procedure.
Specify the framework. Standard SmartPLS criteria can be called PLS-SEM measurement assessment. Composite-model discrepancy testing needs the test, bootstrap configuration and rejection criterion described.
Stating “CCA was performed” is insufficient. Identify common-factor/composite specification, assessed indices, bootstrap settings and decision criteria.
8. Practical workflow from pilot to main model
This workflow suits reflective scales with planned PLS-SEM. Formative, diagnostic or high-consequence individual assessment requires separately designed validation standards.
Version every stage. Major item revisions create a partly new instrument requiring reassessment. Do not pool pre-/post-revision responses as though respondents answered identical questions.
Fix definitions and content domains
Identify factors or composites, expected dimensions and necessary coverage.
Cognitive interviews
Examine understanding, retrieval, judgment and response selection.
Operational pilot
Test flow, skip logic, timing, missingness, coding and export.
Inspect pilot data
Review distributions, variance, unusual correlations, coding and Alpha as preliminary signals.
Decide whether EFA is justified
Require an exploratory objective and data supporting stability; otherwise move to an adequate development sample.
Revise and finalize the questionnaire
Log every change and retest substantial revisions before main collection.
Collect main data and assess measurement
Read loadings, Alpha, rho_A, rho_C, AVE, HTMT and CIs according to construct type.
Assess structure
Interpret paths, R², f², prediction and hypotheses only after defending measurement.
9. Illustration: piloting trust in a learning platform
These hypothetical numbers illustrate decisions, not empirical findings. A questionnaire has three reflective constructs with four items each. Cognitive interviews reveal a double-barreled item and a confusing reversed item. The team revises the former and changes the latter to positive wording.
Operational piloting finds 18% missingness because a not-applicable option was absent. This is fixed before inspecting Alpha. One construct has Alpha = 0.68; a negative item-total correlation prompts coding checks, revealing missing reverse coding. Recalculate only after correcting the process.
The pilot cannot support stable EFA for the intended structure, so no factor solution is reported. EFA moves to a larger development sample with parallel analysis, common-factor extraction and oblique rotation. Main-sample PLS-SEM measurement is assessed after finalizing the questionnaire.
| Finding | Tempting mistake | Appropriate decision |
|---|---|---|
| Double-barreled item | Retain because Alpha is unchanged | Rewrite and cognitively retest |
| Item-specific missingness | Delete every affected case | Revise options and survey logic |
| Negative item-total correlation | Delete immediately | Check reverse coding and original data |
| Small pilot sample | Run EFA and declare confirmation | Move EFA to an adequate sample |
| Alpha 0.68 | Declare scale failure | Inspect CI, item count, content and subsequent measurement |
10. Reporting template and publication checklist
Separate pilots from main-sample analysis. Describe each round’s objectives, participants, revisions, settings and evidence limits. If a pilot supports operations only, state that scope.
Present sourced thresholds as guidelines. Interface colors cannot replace reasoning. Give content and statistical reasons for deletions so readers can assess domain consequences.
Reporting example in English
The questionnaire underwent two pilot rounds. Cognitive interviews with [participants] examined comprehension and response options; [number] items changed because [reasons]. An operational pilot, N = [ ], assessed time, missingness, skip logic and coding. Alpha was a preliminary diagnostic, not unidimensionality evidence; construct values ranged from [ ] to [ ]. [EFA used a development sample N = ... with ... correlations, ... extraction, parallel analysis and ... rotation / EFA was not conducted in the pilot because data could not support stability]. Main-sample reflective measurement used loadings, Alpha, rho_A, rho_C, AVE and HTMT with bootstrap CIs [settings]. Retention reflected theory, content validity and statistics.
- Prespecify each pilot round’s objective.
- Check confusing/double-barreled questions and skip logic.
- Check reversed-item coding before Alpha.
- Do not use Alpha to establish unidimensionality.
- Do not present thresholds as absolute rules.
- Require exploration and adequate data for EFA.
- Report correlations, extraction, retention and rotation.
- Distinguish PCA from EFA.
- Specify factors or composites.
- Assess main PLS-SEM measurement with loadings, reliability, AVE and HTMT.
- Report bootstrap subsamples, CI type and random seed.
- Log every revision and deletion.
- Identify hypothetical examples.
- Match every citation to a reference.
Conclusion
Alpha is a conditional reliability diagnostic, and EFA explores structure with adequate data. Their value depends on appropriate roles; neither replaces content, understanding or operational checks.
A good pilot may end without EFA when the sample is unsuitable. This is more rigorous than legitimizing a questionnaire with an unstable factor solution.
References
- Cronbach, L. J. (1951). Coefficient alpha and the internal structure of tests. Psychometrika, 16(3), 297-334.https://doi.org/10.1007/BF02310555
- Dijkstra, T. K., & Henseler, J. (2015). Consistent and asymptotically normal PLS-PM estimators for linear structural equations. Computational Statistics & Data Analysis, 81, 10-23.https://doi.org/10.1016/j.csda.2014.07.008
- Fabrigar, L. R., Wegener, D. T., MacCallum, R. C., & Strahan, E. J. (1999). Evaluating the use of exploratory factor analysis in psychological research. Psychological Methods, 4(3), 272-299.https://doi.org/10.1037/1082-989X.4.3.272
- Hair, J. F., Howard, M. C., & Nitzl, C. (2020). Assessing measurement model quality in PLS-SEM using confirmatory composite analysis. Journal of Business Research, 109, 101-110.https://doi.org/10.1016/j.jbusres.2019.11.069
- Hair, J. F., Hult, G. T. M., Ringle, C. M., & Sarstedt, M. (2022). A primer on partial least squares structural equation modeling (PLS-SEM) (3rd ed.). SAGE Publications.https://us.sagepub.com/en-us/nam/a-primer-on-partial-least-squares-structural-equation-modeling-pls-sem/book270548
- Hair, J. F., & Sarstedt, M. (2019). Factors versus composites: Guidelines for choosing the right structural equation modeling method. Project Management Journal, 50(6), 619-624.https://doi.org/10.1177/8756972819882132
- Holgado–Tello, F. P., Chacón–Moscoso, S., Barbero–García, I., & Vila–Abad, E. (2010). Polychoric versus Pearson correlations in exploratory and confirmatory factor analysis of ordinal variables. Quality & Quantity, 44(1), 153-166.https://doi.org/10.1007/s11135-008-9190-y
- Horn, J. L. (1965). A rationale and test for the number of factors in factor analysis. Psychometrika, 30(2), 179-185.https://doi.org/10.1007/BF02289447
- MacCallum, R. C., Widaman, K. F., Zhang, S., & Hong, S. (1999). Sample size in factor analysis. Psychological Methods, 4(1), 84-99.https://doi.org/10.1037/1082-989X.4.1.84
- McDonald, R. P. (1999). Test theory: A unified treatment. Lawrence Erlbaum Associates.https://www.routledge.com/Test-Theory-A-Unified-Treatment/McDonald/p/book/9781138012547
- Schuberth, F. (2021). Confirmatory composite analysis using partial least squares: Setting the record straight. Review of Managerial Science, 15, 1311-1345.https://doi.org/10.1007/s11846-020-00405-0
- Sijtsma, K. (2009). On the use, the misuse, and the very limited usefulness of Cronbach’s alpha. Psychometrika, 74(1), 107-120.https://doi.org/10.1007/s11336-008-9101-0
- SmartPLS. (n.d.). Bootstrapping in PLS-SEM: Significance testing in SmartPLS.https://smartpls.com/documentation/algorithms-and-techniques/resampling-and-inference/bootstrapping/
Methodological note: This methodological guide sets no universal sample size or cutoff. Justify EFA and PLS-SEM N through the model, indicator quality, inference objective and desired precision.