
PCLOSE in AMOS: Testing RMSEA Close Fit and Reporting Correctly
PCLOSE is neither the model’s p-value nor an indication of whether RMSEA equals 0. It tests a population close-fit hypothesis, so interpret it alongside RMSEA, its confidence interval, degrees of freedom, and sample size.
In AMOS, PCLOSE tests whether population RMSEA lies in the close-fit region around 0,05. PCLOSE above alpha indicates only insufficient evidence to reject close fit; it does not establish model correctness or replace residuals, CFI, TLI, SRMR, or specification assessment.
PCLOSE: read the test alongside RMSEA
- RMSEA
Read the point estimate
- Confidence interval
Inspect uncertainty in RMSEA
- PCLOSE
Read the close-fit hypothesis
- Synthesis
Consider other fit evidence
Conceptual diagram. A single p-value cannot replace an overall model assessment.
Source: Lê Minh · Conceptual illustration, not software output.1. What Should You Be Able to Do After This Article?
After this guide, you should distinguish exact-fit from close-fit tests, correctly interpret the direction of the PCLOSE hypothesis, retrieve RMSEA and its confidence interval from AMOS, identify situations in which PCLOSE is uninformative, and write results without treating a p-value as proof of model correctness.
The prerequisite is an identified, converged CFA or SEM model. If there are negative variances, impossible loadings, abnormal standard errors, or nonconvergence warnings, stop before interpreting PCLOSE.
- The model has converged without an improper solution.
- Record chi-square, df, sample size, and estimation method.
- Obtain RMSEA and its 90% confidence interval.
- Know the alpha used for the close-fit test.
- Examine CFI, TLI, SRMR, and residuals.
- Treat PCLOSE as supplementary evidence rather than the sole criterion.
2. Understand RMSEA Before Interpreting PCLOSE
RMSEA estimates the model’s population approximation error per degree of freedom. Unlike the chi-square exact-fit test, RMSEA allows the model to be an approximation. The point estimate always involves uncertainty, usually presented as a 90% confidence interval (MacCallum et al., 1996).
The 0,05 benchmark commonly represents close fit within this testing framework, but it is a practical convention rather than a natural boundary. RMSEA depends on degrees of freedom, sample size, and misspecification type. Kline (2023) recommends assessing multiple sources of evidence instead of classifying models using one cutoff.
The confidence interval indicates RMSEA’s precision. A low RMSEA with a very wide interval provides weaker evidence than a similar estimate with a narrow interval.
| Component | Question | Must not be interpreted as |
|---|---|---|
| RMSEA point estimate | What is the estimated approximation error? | The probability that the model is correct |
| 90% confidence interval | Over what range does population RMSEA remain uncertain? | An interval containing 90% of samples |
| PCLOSE | Do the data provide evidence against close fit? | The p-value of the RMSEA point estimate |
3. The PCLOSE Hypothesis and Direction of Inference
AMOS describes PCLOSE as the p-value for testing whether population RMSEA is below 0,05, consistent with Browne and Cudeck’s (1993) close-fit framework. In practice, the null is commonly written H0: epsilon <= 0,05 and the alternative H1: epsilon > 0,05.
If PCLOSE <= alpha, reject close fit at the selected alpha level. If PCLOSE > alpha, there is insufficient evidence to reject close fit. The latter does not prove model fit, because failure to reject H0 differs from confirming that H0 is true.
Larger PCLOSE values do not indicate linearly better models. Models with PCLOSE 0,40 and 0,80 may both fail to reject close fit, but RMSEA, confidence intervals, residuals, and other indices must still be compared.
The correct statement is that there is insufficient evidence to reject the close-fit hypothesis at the chosen alpha. Next examine the RMSEA upper bound, CFI, TLI, SRMR, residuals, and model plausibility.
4. Distinguishing Exact Fit, Close Fit, and Not-Close Fit
The traditional chi-square test specifies H0 that the model-implied covariance matrix exactly matches the population matrix. With large samples, small discrepancies can produce significant chi-square results. The RMSEA framework instead asks whether approximation error is acceptable (MacCallum et al., 1996).
The close-fit test asks whether population RMSEA lies in a small region, commonly defined by 0,05. Another test can specify H0 that RMSEA indicates not-close fit, for example 0,08 or higher, to seek evidence of good fit. AMOS reports PCLOSE for the close-fit test; not every p-value associated with RMSEA should be called PCLOSE.
Exact fit and close fit address different hypotheses. A model with significant chi-square can still fail to reject close fit, particularly when absolute discrepancy is small but sample size is large.
| Test | General H0 | Favorable result | Limitation |
|---|---|---|---|
| Chi-square exact fit | Population discrepancy equals 0 | p > alpha | Sensitive to sample size and small discrepancies |
| PCLOSE | Population RMSEA <= 0,05 | p > alpha, close fit not rejected | Does not prove model correctness |
| Test of not-close fit | Population RMSEA >= a benchmark such as 0,08 | Small p-value, rejecting not-close fit | Not the standard PCLOSE test in AMOS |
| RMSEA CI | Not a single test | Low upper bound relative to the objective | Depends on df and sample size |
5. Retrieving PCLOSE in AMOS
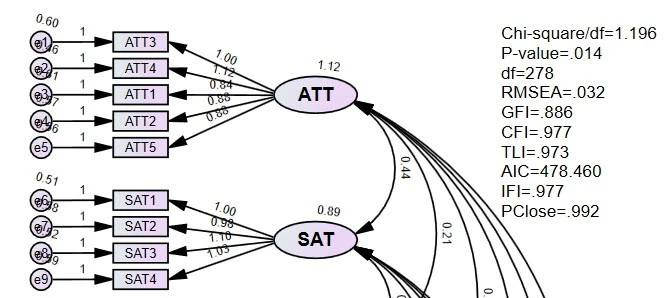
In AMOS Graphics, open Analysis Properties, select Output, and enable Fit measures if needed. After estimation, open Text Output, locate Model Fit, and inspect RMSEA. The table usually shows RMSEA, LO 90, HI 90, and PCLOSE. IBM Corp. (2022) describes PCLOSE and related macros in the AMOS 29 guide.
Record the Default model results. The Independence model and saturated model serve other comparisons and are not the PCLOSE values to cite for the research model.
Always record the AMOS version and estimator. Describe bootstrapping or missing-data handling separately because these choices affect other parts of estimation.
Run the initial model
Verify convergence and the absence of solution warnings before examining fit indices.
Open the RMSEA table
In Text Output, select Model Fit and find the Default model row under RMSEA.
Record four values
Save RMSEA, LO 90, HI 90, and PCLOSE alongside chi-square and df.
Check hypothesis direction
Compare PCLOSE with alpha to decide whether close fit is rejected or not rejected.
Examine uncertainty
Read both confidence-interval bounds rather than only the RMSEA point estimate.
Cross-check fit and residuals
Examine CFI, TLI, SRMR, and standardized residuals before concluding.
6. Hypothetical Numerical Example: Three Very Different Results
The following example is illustrative rather than an actual study. Model A has RMSEA = 0,041, 90% CI [0,030; 0,052], and PCLOSE = 0,82. At alpha = 0,05, close fit is not rejected; the 0,052 upper bound also indicates relatively narrow uncertainty around close fit.
Model B has RMSEA = 0,061, 90% CI [0,051; 0,072], and PCLOSE = 0,03. Close fit is rejected because PCLOSE is below 0,05. This does not automatically require rejecting the model; consider the objective, residuals, CFI, TLI, SRMR, and meaning of the discrepancy.
Model C has df = 5, RMSEA = 0,075, 90% CI [0,000; 0,151], and PCLOSE = 0,23. Failure to reject close fit here accompanies a very wide confidence interval. The evidence is too imprecise to confidently describe the model as close-fitting.
| Model | df | RMSEA | 90% CI | PCLOSE | Qualified conclusion |
|---|---|---|---|---|---|
| A | 85 | 0,041 | [0,030; 0,052] | 0,82 | Close fit not rejected; reasonably consistent evidence |
| B | 85 | 0,061 | [0,051; 0,072] | 0,03 | Reject close fit at alpha = 0,05 |
| C | 5 | 0,075 | [0,000; 0,151] | 0,23 | Not rejected, but estimation is very imprecise |
7. Degrees of Freedom, Sample Size, and Power Affect Interpretation
RMSEA and PCLOSE depend on df and sample size. With very low df, RMSEA can be positive and highly variable even without serious misspecification. Kenny, Kaniskan, and McCoach (2015) show that RMSEA can perform poorly in low-df models, especially with smaller samples.
PCLOSE > 0,05 may arise because the model genuinely approximates the population closely, but also because the test lacks power. Conversely, large samples can detect small discrepancies. This is why confidence intervals and design context must be presented.
MacCallum et al. (1996) develop RMSEA-based power analysis by defining values under H0 and H1. If close fit is an important research-planning criterion, consider power during design rather than only after data collection.
When df is very low and the RMSEA confidence interval is wide, reduce the certainty of the conclusion. Do not classify a model as good or bad using PCLOSE alone.
8. Place PCLOSE Within a System of Evidence
Assess overall fit across several layers: chi-square and df, RMSEA with its confidence interval, CFI, TLI, SRMR, standardized residuals, and parameter checks. Fit indices cannot detect every local misspecification.
A model with favorable PCLOSE but low loadings, impossible factor correlations, or large residuals still requires review. A model with small PCLOSE but stable parameters and discrepancies concentrated in an anticipated area may require discussion, model comparison, or new data rather than automatic modification.
Kline (2023) emphasizes that fit indices are only part of SEM assessment. Theoretical plausibility, measurement quality, and replicability determine the model’s value.
| Layer | Information | Question |
|---|---|---|
| 1. Solution | Convergence, variances, loadings, correlations | Are the results mathematically admissible? |
| 2. Global fit | chi-square, RMSEA CI, PCLOSE, CFI, TLI, SRMR | What is the overall discrepancy? |
| 3. Local fit | Residuals, justified MI | Where are discrepancies concentrated? |
| 4. Theory | Definitions and relationships | Does the model retain a coherent interpretation? |
| 5. Validation | Another sample or sensitivity analysis | Are conclusions stable beyond the sample? |
9. Common Interpretation Errors
| Weak wording | Problem | Better wording |
|---|---|---|
| PCLOSE = 0,20, so the model is good | Failure to reject H0 is presented as confirmation | Close fit was not rejected at the selected alpha |
| PCLOSE < 0,05, so RMSEA is significant | This does not describe the hypothesis being tested | The hypothesis RMSEA <= 0,05 was rejected |
| The larger PCLOSE, the better | A p-value is not a linear quality measure | Interpret alongside RMSEA and its CI |
| Reporting only the RMSEA point estimate | Ignores uncertainty | Report the 90% CI and PCLOSE |
| Using PCLOSE from any model row | Confuses the default and baseline models | Cite the correct Default model |
| Favorable PCLOSE justifies ignoring residuals | Global fit can conceal local misspecification | Check standardized residuals and parameters |
10. APA 7 Reporting Template and Checklist
The following template uses hypothetical Model A values. For actual studies, replace all numbers and state the estimator, sample size, and AMOS version.
Example report
The model was estimated using IBM SPSS Amos [version] with [estimator], N = [ ]. Results indicated chi-square([df]) = [ ], p = [ ]. RMSEA = .041, 90% CI [.030, .052], and PCLOSE = .820. At alpha = .05, the close-fit hypothesis was not rejected. This conclusion was considered alongside CFI = [ ], TLI = [ ], SRMR = [ ], and standardized residuals. Together, the indices indicated [qualified conclusion], but were not interpreted as proof of absolute model correctness.
- Report chi-square, df, and sample size.
- Report RMSEA with its 90% CI.
- Explicitly state PCLOSE’s H0.
- Use “not rejected” rather than unconditional acceptance.
- Consider low df and wide confidence intervals.
- Consider power when close-fit testing is an important objective.
- Cross-check CFI, TLI, and SRMR.
- Inspect standardized residuals.
- Check the solution and abnormal parameters.
- Avoid modifying the model solely to increase PCLOSE.
Conclusion
PCLOSE adds an inferential perspective to RMSEA: do the data provide sufficient evidence against the close-fit region? It does not establish whether a model is correct, causal, or valid in measurement terms.
Trustworthy reporting always places PCLOSE alongside RMSEA, confidence intervals, df, sample size, and other diagnostics. With low df or wide confidence intervals, conclusions must be more cautious.
References
- Browne, M. W., & Cudeck, R. (1993). Alternative ways of assessing model fit. In K. A. Bollen & J. S. Long (Eds.), Testing structural equation models (pp. 136-162). SAGE.https://psycnet.apa.org/record/1993-97289-006
- MacCallum, R. C., Browne, M. W., & Sugawara, H. M. (1996). Power analysis and determination of sample size for covariance structure modeling. Psychological Methods, 1(2), 130-149.https://doi.org/10.1037/1082-989X.1.2.130
- Kenny, D. A., Kaniskan, B., & McCoach, D. B. (2015). The performance of RMSEA in models with small degrees of freedom. Sociological Methods & Research, 44(3), 486-507.https://doi.org/10.1177/0049124114543236
- Kline, R. B. (2023). Principles and practice of structural equation modeling (5th ed.). Guilford Press.https://www.guilford.com/books/Principles-and-Practice-of-Structural-Equation-Modeling/Rex-Kline/9781462551910
- IBM Corp. (2022). IBM SPSS Amos 29 user's guide.https://www.ibm.com/docs/en/SSLVMB_29.0.0/pdf/IBM_SPSS_Amos_User_Guide.pdf
Academic note: The example values illustrate interpretation. Specify RMSEA benchmarks and alpha before examining results; do not use PCLOSE as the sole gateway for accepting or rejecting a model.