
Combining a 2×2 Experimental Design with SEM: From Mediation to Moderated Mediation
A 2×2 design identifies effects of two manipulated factors. SEM tests psychological mechanisms between conditions and outcomes, but indirect effects require additional causal assumptions.
Check randomization and manipulations, estimate 2×2 main effects and interactions, validate measurement, then test specific indirect effects and moderated-mediation indices with bootstrap CIs.
1. Learning objectives and input structure
Design four conditions, code two factors, assess main effects and interactions, specify mediation, choose indirect-effect tests and report reproducibly. The workflow suits randomized factors with mediators/outcomes measured as observed scores or latent variables.
Use one participant per row. Code binary factors 0/1: DISCLOSE = 0 without AI-identity disclosure and DISCLOSE = 1 with disclosure; PRESENCE = 0 for low social presence and PRESENCE = 1 for high presence. Keep separate trust, warmth, attitude and purchase-intention items, plus IDs, measurement times, exclusions and manipulation checks.
| Column group | Example | Use |
|---|---|---|
| Identifier | ID | Trace participants; not an analytical variable |
| Factor A | DISCLOSE: 0/1 | Estimate A’s main effect |
| Factor B | PRESENCE: 0/1 | Estimate B’s main effect |
| Interaction | DISCLOSE × PRESENCE | Test whether A’s effect depends on B |
| Mediator | TRUST1 to TRUST4 | CFA/SEM indicators or justified scale scores |
| Outcome | ATT1 to ATT4; BUY1 to BUY3 | Dependent variable/endogenous construct |
| Manipulation checks | MC_DISCLOSE; MC_PRESENCE | Check recognition of the manipulation |
- Assign one unique ID per participant.
- Code factors 0/1 and document reference groups.
- Prespecify exclusions and save flags.
- Reverse-code according to the codebook without editing original data.
- Report observations and exclusion rates in each of four cells.
2. Interpret a 2×2 factorial experiment
A 2×2 design has two independent factors with two levels, producing four conditions, two main effects and an interaction. A’s main effect averages its between-level difference across B. A × B tests whether A’s difference varies with B.
Study 2 of De Cicco et al. (2025) manipulates AI disclosure and chatbot social presence. Its analyzed sample has 231 participants after exclusions, with 51 to 62 per cell. This illustrates the design context; it is not an accompanying dataset.
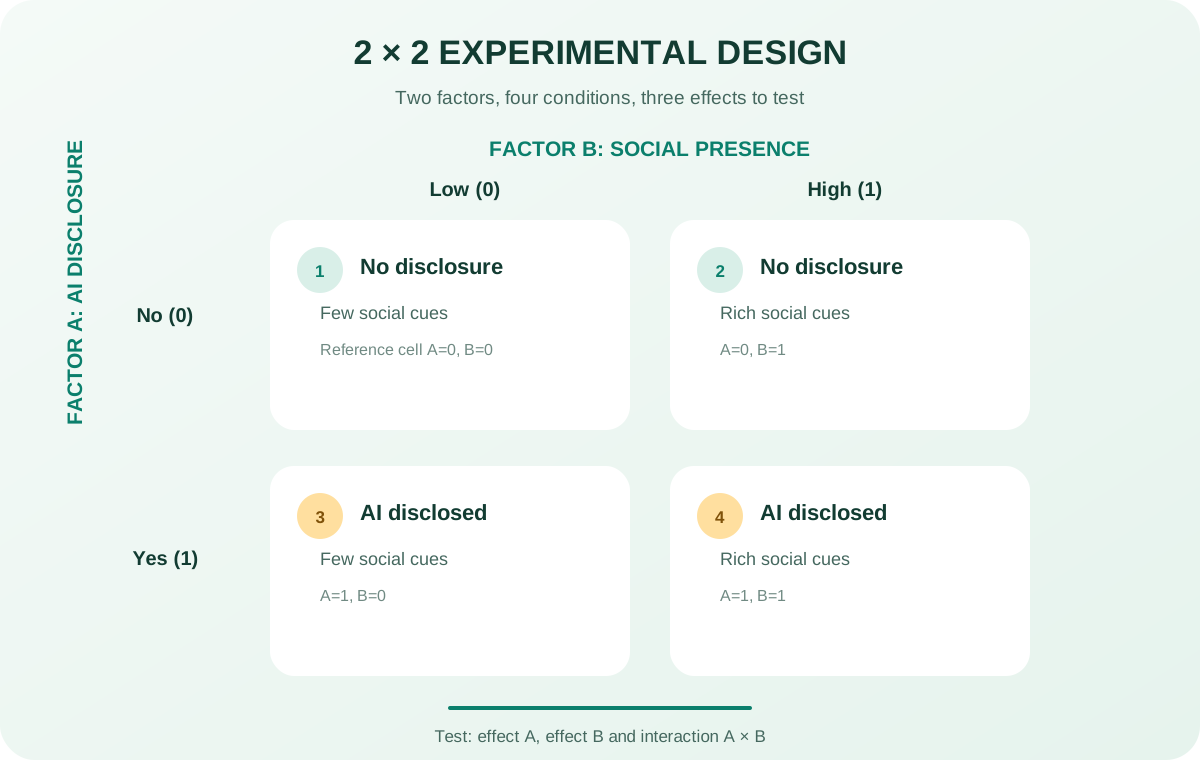
With meaningful A × B interaction, main effects average over the other factor’s levels. Examine simple effects or estimated marginal means before conclusions about A and B.
3. What does SEM add?
ANOVA or interaction regression assesses condition effects. SEM models psychological measurement, estimates several mediator paths jointly and separates measurement error from construct variance.
This does not make every SEM path causal. Randomization identifies manipulated-factor effects, but mediators are usually not randomized. Causal indirect effects additionally require no unobserved mediator–outcome confounding, appropriate temporal order and specification (VanderWeele, 2016).
| Analysis layer | Question | Main evidence | Limitation |
|---|---|---|---|
| 2×2 ANOVA/regression | How do A, B and A × B affect Y? | Marginal means, interaction and simple effects | Does not fully model measurement error |
| CFA | Do measures adequately represent constructs? | Loadings, reliability, convergence and distinctiveness | Does not establish causal ordering |
| Mediation SEM | Through which mechanism does an effect operate? | Indirect effects and CIs | Additional causal assumptions |
| Moderated mediation | Under which conditions does an indirect mechanism change? | Conditional indirect effects and difference indices | Cannot be inferred from separate p-values |
4. Parallel mediation: distinguish competing mechanisms
Parallel mediation links X to Y through at least two mediators without assuming one causes another. M1 and M2 specific effects are a1b1 and a2b2; total indirect effect is a1b1 + a2b2 and total effect also includes c'. Preacher and Hayes (2008) recommend joint estimation and resampling inference for each indirect effect.
A chatbot illustration could place trust and warmth on parallel AI-disclosure-to-attitude paths. Warmth and competence appear in service-robot research, but a new study needs justified hypotheses and measures rather than borrowing concepts solely because a prior paper used them (Li et al., 2024).
The total indirect CI does not identify whether M1 or M2 supplies evidence. Report a1b1, a2b2 and their CIs, and compare effects when hypothesized.
5. Serial mediation needs theoretical and design-based ordering
Serial mediation represents X → M1 → M2 → Y, with chain effect a1d21b2. Models often retain X → M2, M1 → Y and X → Y to avoid forcing all effects through one chain. Establish M1 before M2 through theory, timing or further manipulation.
An illustrative extension of De Cicco et al. (2025) is AI disclosure → trust → company attitude → purchase intention. The original reports trust separately mediating attitude and purchase intention; this three-step chain is an illustration, not a verbatim tested original model.
Simultaneously measured M1, M2 and Y cannot establish M1 preceding M2 merely from serial-model fit. Consider repeated occasions, manipulating a mediator or causal sensitivity analysis.
6. Moderated mediation: test conditional indirect effects
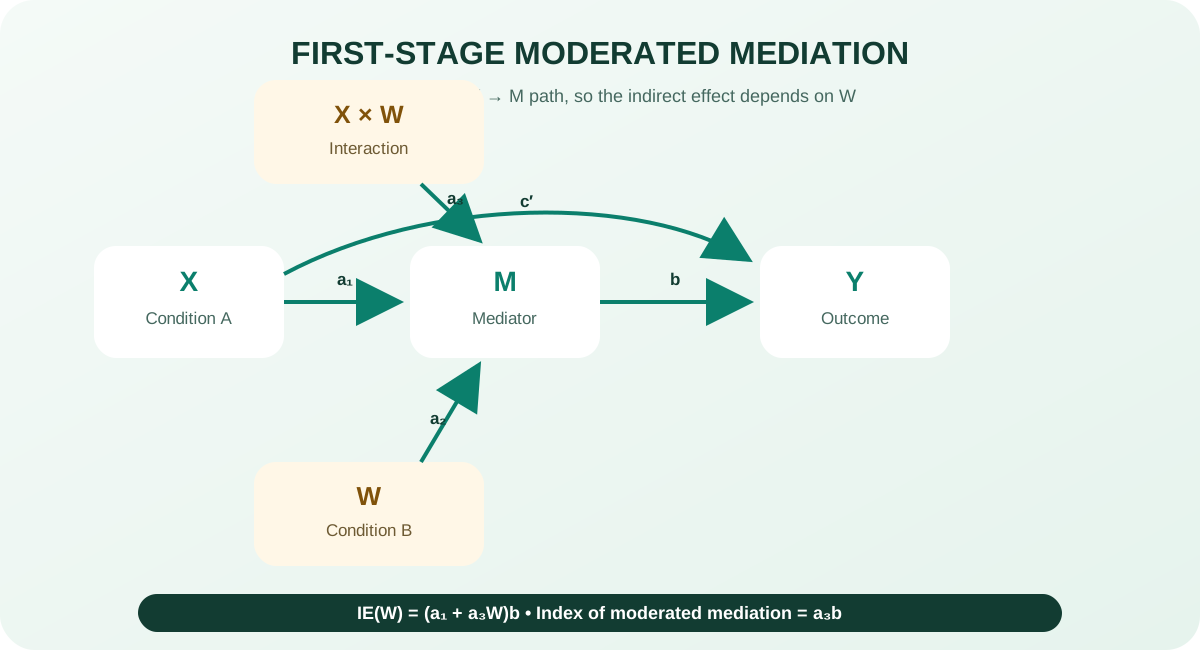
Moderated mediation means X’s indirect effect through M varies with W. For first-stage moderation, IE(W) = (a1 + a3W)b and the linear index is a3b. For second-stage moderation, IE(W) = a(b1 + b3W) and the index is ab3 (Hayes, 2015; Preacher et al., 2007).
De Cicco et al. (2025) find the negative disclosure effect disappears under high social presence. Using this as a methodological framework requires directly testing conditional indirect-effect differences. Significance at W = 0 and nonsignificance at W = 1 do not establish a difference.
Reporting example in English
The first-stage moderated-mediation index was [value], bootstrap 95% CI [lower; upper], from [number] resamples. The interval [excluded/included] 0, providing [evidence/no clear evidence] that [X]’s indirect effect on [Y] through [M] varied with [W]. Conditional indirect effects were [value; CI] at W = 0 and [value; CI] at W = 1.
7. Step-by-step workflow from raw data to conclusions
Separate design assessment from mechanisms. Do not proceed directly to SEM with unclear allocation, exclusions or manipulation checks. Preserve each step’s tables, syntax or project files.
Step 1. Fix hypotheses before inspecting results
Draw A, B, A × B, mediators and outcomes. Identify confirmatory/exploratory paths, first-/second-stage moderation and indirect effects to report.
Step 2. Reconcile allocation and participant flow
Tabulate assigned, completed and excluded cases by cell. Check missingness, time, attention and quality using prespecified rules. Do not remove participants for inconvenient results.
Step 3. Assess manipulations
Fit separate models for manipulation checks and report differences, CIs and effect sizes. Failed checks indicate design issues, not automatic participant exclusion.
Step 4. Estimate baseline 2×2 effects
Fit Y = b0 + b1A + b2B + b3(A × B) + e. Read b3 first; examine simple effects/marginal means for meaningful interaction. Preserve this baseline before mediation.
Step 5. Assess measurement
For latent constructs, use CFA or PLS-SEM measurement assessment. Check loadings, errors, reliability and convergent/discriminant validity. Assess invariance for the intended condition comparisons (Putnick & Bornstein, 2016).
Step 6. Estimate specific mechanisms
Specify direct, a and b paths, justified parallel-mediator covariances and prespecified controls. Extract specific and total indirect effects with bootstrap CIs.
Step 7. Test moderated mediation
Specify the interaction at the intended stage. Calculate indirect effects at meaningful W levels and test the index or their direct difference (Edwards & Lambert, 2007; Hayes, 2015).
Step 8. Assess sensitivity
Compare prespecified controlled/uncontrolled models, exclusion criteria and plausible mediator orders; discuss unobserved M–Y confounding. Identify post hoc analyses.
Step 9. Package reproducibility materials
Save deidentified analysis data, codebook, syntax/projects, parameter tables, bootstrap count, supported seeds and decisions. Match tables to the diagram’s exact model version.
8. Read output in a fixed sequence
Present the claim, evidence and limits. Name the effect, report estimate, SE/CI and effect size, then identify conditions such as observed/latent measurement, bootstrap count and temporal measurement.
The 5,000 bootstrap samples in Study 2 of De Cicco et al. (2025) are that study’s practical choice, not an accuracy guarantee. Use enough resamples for stable intervals and report the count.
| Order | Output | Assessment question |
|---|---|---|
| 1 | Participant flow and cell balance | Do exclusions or missingness differ by condition? |
| 2 | Manipulation checks | Did the check change in the intended direction? |
| 3 | A, B, and A × B | Main effect or interaction? |
| 4 | Measurement model | Are constructs reliable and distinct? |
| 5 | Direct and indirect paths | Which mechanism is supported; does the CI include 0? |
| 6 | Moderated-mediation index | Do the indirect effects differ directly? |
| 7 | Sensitivity | Are conclusions stable under plausible alternatives? |
9. Choose software for the required model
Software cannot determine design quality. Choose according to observed-score/latent mediators, observed/latent interactions and CB-SEM, PLS-SEM or conditional regression. Multiple tools can check results, but main hypotheses require a consistent estimation strategy.
| Tool | Suitable for | Report explicitly |
|---|---|---|
| SPSS/PROCESS | ANOVA, regression, mediation and observed-variable conditional processes | Model template, coding and bootstrap count |
| AMOS | CFA, CB-SEM, bootstrap and multigroup comparisons | Interaction construction or grouping strategy |
| SmartPLS | PLS-SEM, indirect effects and some moderation models | PLS-SEM rationale and measurement assessment |
| R/lavaan | CFA, SEM, syntax-defined indirect effects and multigroup SEM | Estimator, missingness and derived-parameter syntax |
| Mplus | Complex SEM, categorical data and latent interactions | Estimator, integration algorithm and CI method |
Report differing plausible estimates as sensitivity evidence rather than selecting favorable results and hiding disagreement.
10. Common mistakes and corrections
| Mistake | Problem | Correction |
|---|---|---|
| Only four between-cell t-tests | Does not directly test factorial structure/interaction | Use A, B and A × B factorial regression |
| Interpreting main effects despite significant interaction | Main effects average over the other factor | Examine simple effects and marginal means |
| Good SEM fit establishes a causal mechanism | Fit does not rule out M → Y confounding or reverse order | State assumptions, timing and sensitivity |
| One significant indirect effect and one nonsignificant means groups differ | Different p-values are not a difference test | Test the index or indirect-effect difference |
| Adding mediators to look comprehensive | Every path requires theory and identification | Retain justified, measurably distinct mechanisms |
| Different scales across four cells | Differences may reflect measurement | Maintain consistent measures and assess invariance where needed |
11. APA 7 reporting template and submission checklist
This is a writing framework, not fixed wording. Replace all brackets with actual results, identify standardized/unstandardized coefficients and use consistent decimal precision.
Reporting example in English
Participants were randomized to a 2 (A: [level 0; level 1]) × 2 (B: [level 0; level 1]) design. Factorial analysis [supported/did not support] A × B, b = [ ], SE = [ ], 95% CI [ ; ], p = [ ]. Simple A effects were [ ] at B = 0 and [ ] at B = 1. In SEM, A’s indirect effect on Y through M was ab = [ ], bootstrap 95% CI [ ; ], from [number] resamples. The moderated-mediation index was [ ], 95% CI [ ; ], indicating that the indirect effect [did/did not] vary with B. Because the mediator was not randomized, mechanistic interpretation relied on the stated causal assumptions.
- Report cell sizes before/after exclusions.
- State 0/1 codes and reference levels.
- Report A, B, A × B and relevant simple effects.
- Separate manipulation checks from main outcomes.
- Describe estimator, missing-data treatment and bootstrap count.
- Report every indirect effect and CI.
- Test moderated mediation directly, not separate p-values.
- Identify post hoc models and paths.
- Match references with in-text citations.
Conclusion
2×2 designs and SEM address different questions. Experiments identify manipulated-condition effects; SEM models hypothesized mechanisms and measurement error. Keep these evidence layers distinct before connecting them through indirect effects.
Follow a fixed sequence: inspect data/manipulations, read A × B, validate measurement, estimate indirect effects, test moderated mediation directly, then conclude. Report mediator confounding and temporal-order limitations alongside results.
References
- De Cicco, R., Elmashhara, M. G., Silva, S. C., & Hammerschmidt, M. (2025). The impact of providing non-human identity cues about sales agents on consumer responses: The role of social presence and speciesism activation. European Journal of Marketing, 59(13), 55-84.https://doi.org/10.1108/EJM-01-2022-0066
- Edwards, J. R., & Lambert, L. S. (2007). Methods for integrating moderation and mediation: A general analytical framework using moderated path analysis. Psychological Methods, 12(1), 1-22.https://doi.org/10.1037/1082-989X.12.1.1
- Hayes, A. F. (2015). An index and test of linear moderated mediation. Multivariate Behavioral Research, 50(1), 1-22.https://doi.org/10.1080/00273171.2014.962683
- Li, Y., Zhou, X., Jiang, X., Fan, F., & Song, B. (2024). How service robots’ human-like appearance impacts consumer trust: A study across diverse cultures and service settings. International Journal of Contemporary Hospitality Management, 36(9), 3151-3167.https://doi.org/10.1108/IJCHM-06-2023-0845
- Preacher, K. J., & Hayes, A. F. (2008). Asymptotic and resampling strategies for assessing and comparing indirect effects in multiple mediator models. Behavior Research Methods, 40(3), 879-891.https://doi.org/10.3758/BRM.40.3.879
- Preacher, K. J., Rucker, D. D., & Hayes, A. F. (2007). Addressing moderated mediation hypotheses: Theory, methods, and prescriptions. Multivariate Behavioral Research, 42(1), 185-227.https://doi.org/10.1080/00273170701341316
- Putnick, D. L., & Bornstein, M. H. (2016). Measurement invariance conventions and reporting: The state of the art and future directions for psychological research. Developmental Review, 41, 71-90.https://doi.org/10.1016/j.dr.2016.06.004
- VanderWeele, T. J. (2016). Mediation analysis: A practitioner's guide. Annual Review of Public Health, 37, 17-32.https://doi.org/10.1146/annurev-publhealth-032315-021402
Methodological note: The three-mediator model and trust → attitude → purchase-intention chain illustrate methodology; they are not a single paper’s verbatim tested model. Choose estimators, categorical-data treatment and interaction strategies for the actual design.