
T-Tests and One-Way ANOVA in SPSS: Choosing the Right Test and Interpreting Effect Sizes
The number of groups is only the starting point for choosing a test. Establish whether groups are independent or repeated, whether variances are equal, and whether the difference is large enough to matter.
Use an independent t-test for two independent groups, a paired t-test for linked measurements, and one-way ANOVA for three or more independent groups. Report means/SDs, differences, CIs, effect sizes and appropriate post hoc tests.
Comparing means: design first, test second
- Design
Independent groups or repeated measures?
- Measurement
Ensure scores are comparable
- Test
Choose for the groups and assumptions
- Reporting
Difference, effect size and CI
Conceptual diagram. Statistical significance does not establish practical importance.
Source: Lê Minh · Conceptual illustration, not software output.1. Choose by design, not group count alone
| Design | Test |
|---|---|
| One group versus a reference value | One-sample t-test |
| Two independent groups | Independent-samples t-test |
| Two occasions/matched pairs | Paired-samples t-test |
| ≥ 3 independent groups | One-way ANOVA or Welch ANOVA |
| ≥ 3 repeated measurements | Repeated-measures ANOVA or a mixed model |
2. Assumptions to check
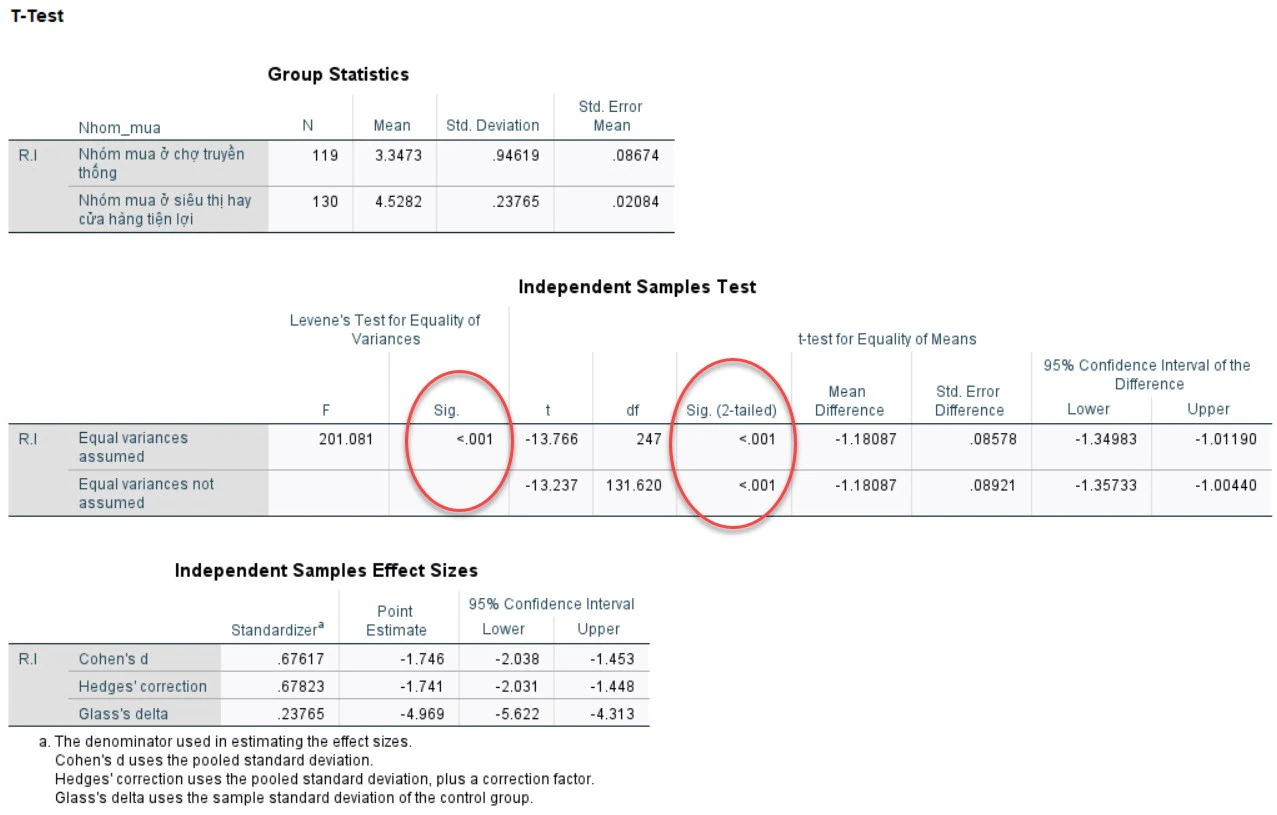
Independence comes from sampling design and cannot be established by a p-value. Inspect normality in residuals, or paired differences for a paired t-test; with moderate/large samples, these tests are reasonably robust to mild departures (George & Mallery, 2022).
Levene’s test examines variance equality. For unequal variances in two groups, read Welch’s t-test; with multiple groups, use Welch ANOVA and Games–Howell post hoc comparisons.
Assumption tests may lack power. Combine them with plots, group sizes, skewness and robust methods.
3. Omnibus ANOVA and post hoc comparisons
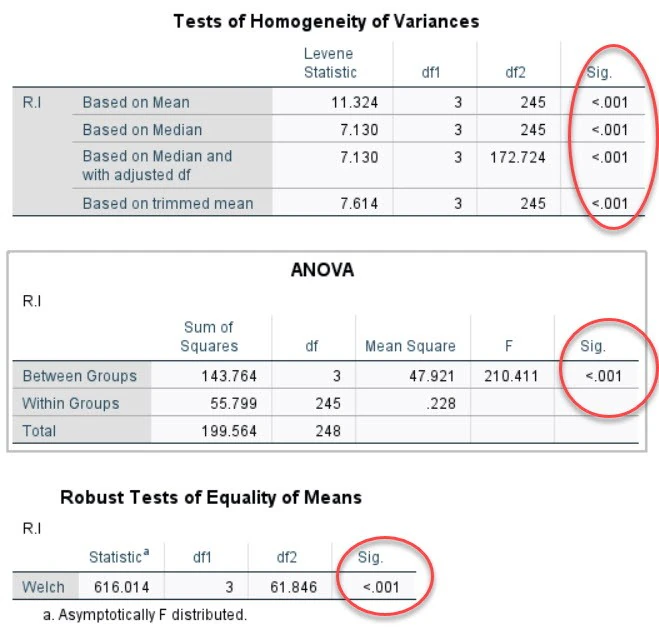
A significant F-test indicates that at least one mean differs, without identifying the pair. Tukey comparisons suit reasonably homogeneous variances; Games–Howell is useful for unequal variances or group sizes.
Do not run every pairwise t-test without adjustment, because family-wise error increases with the number of comparisons.
| Test | Suggested effect size | Also report |
|---|---|---|
| Independent t | Cohen's d or Hedges' g | CI for the difference |
| Paired t | dz or standardized mean change | CI for the mean difference |
| ANOVA | ω² or η² | Post hoc effect sizes and CIs |
4. SPSS workflow
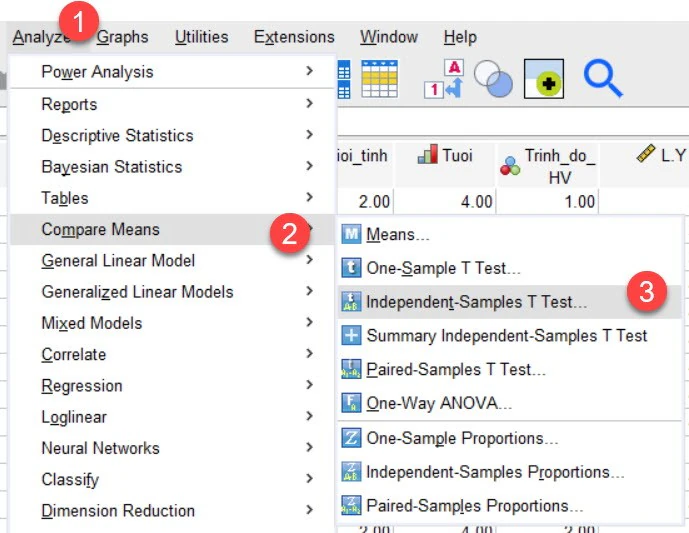
Check the design and group codes
Confirm independence or pairing, group coding and missingness.
Describe the data
Examine N, mean, SD, boxplots and outliers by group.
Select the test
Use the design, group count and variance assumptions.
Read the omnibus test
For ANOVA, interpret F before post hoc comparisons.
Report an effect size
Go beyond the p-value: report differences and CIs.
5. Reporting template
Reporting example in English
[Y] differed between [group A] (M = [ ], SD = [ ]) and [group B] (M = [ ], SD = [ ]), Welch t(df) = [ ], p = [ ], mean difference = [ ], 95% CI [ ; ], Hedges' g = [ ]. / Welch ANOVA indicated an overall difference, F(df1, df2) = [ ], p = [ ], ω² = [ ]; Games–Howell identified [pairs].
- Distinguish independent from paired observations.
- Use Welch results for unequal variances.
- Use appropriate post hoc comparisons with ANOVA.
- Report means, SDs, differences and CIs.
- Include an effect size.
- Do not interpret p > 0.05 as proof that groups are identical.
Conclusion
T-tests and ANOVA address mean differences; effect sizes and CIs describe their magnitude and precision.
References
- George, D., & Mallery, P. (2022). IBM SPSS Statistics 27 step by step.https://doi.org/10.4324/9781003205333
Methodological note: For ordinal outcomes, extreme skewness, very small groups or strong outliers, consider robust methods, permutation tests or a more appropriate model.