
IPMA in SmartPLS 4: From the Map to Defensible Action Priorities
A strong relationship does not automatically identify where to invest: the predictor may already perform well. IPMA combines total effects with current performance, after which uncertainty, measurement content and practical feasibility must inform any recommendation.
IPMA importance is the unstandardized total effect on a selected target; performance is a rescaled 0–100 score. Check theoretical ranges, coding direction and weights first. The map supports prioritization; it does not establish causal intervention effects or return on investment.
IPMA combines importance and performance
- Target construct
Choose the outcome of interest
- Importance
Read total effects on the target
- Performance
Check scoring ranges and coding direction
- Priorities
Consider resources and context
Conceptual diagram. Do not equate a direct path coefficient with the total effect.
Source: Lê Minh · Conceptual illustration, not software output.1. Start with the decision and the target
Suppose service quality and trust both relate to loyalty. Path coefficients describe relationships but do not show how customers currently rate those attributes. When quality is already strong and trust is weak, action priorities may differ from the ordering of coefficients. Importance-performance map analysis addresses this additional question (Ringle & Sarstedt, 2016).
Choose the outcome to improve before interpreting the map. Satisfaction, continued use and loyalty represent different targets. Each target has its own importance values; a ranking for satisfaction cannot simply be transferred to loyalty (Hair et al., 2018, Chapter 3).
This guide uses SmartPLS 4 for the workflow. The complete textbook chapter explains the calculations using an earlier software version; current settings are checked against SmartPLS documentation. Numerical worked examples below are constructed for teaching and are not client findings.
2. Read the two axes before the quadrants
Importance is the unstandardized total effect of a predecessor on the target, adding its direct effect and all indirect paths in the linear model. Do not substitute a standardized beta from the Path coefficients table. Interpretation depends on a compatible scaling of the constructs involved (Hair et al., 2018, Chapter 3).
Performance is the mean rescaled construct score on a 0–100 scale. It is not the percentage of satisfied respondents, a purchase probability or explained variance. A score of 60 locates the construct within its specified range. Construct scores depend on indicator weights and are not automatically arithmetic item means (Hair et al., 2018, Chapter 3).
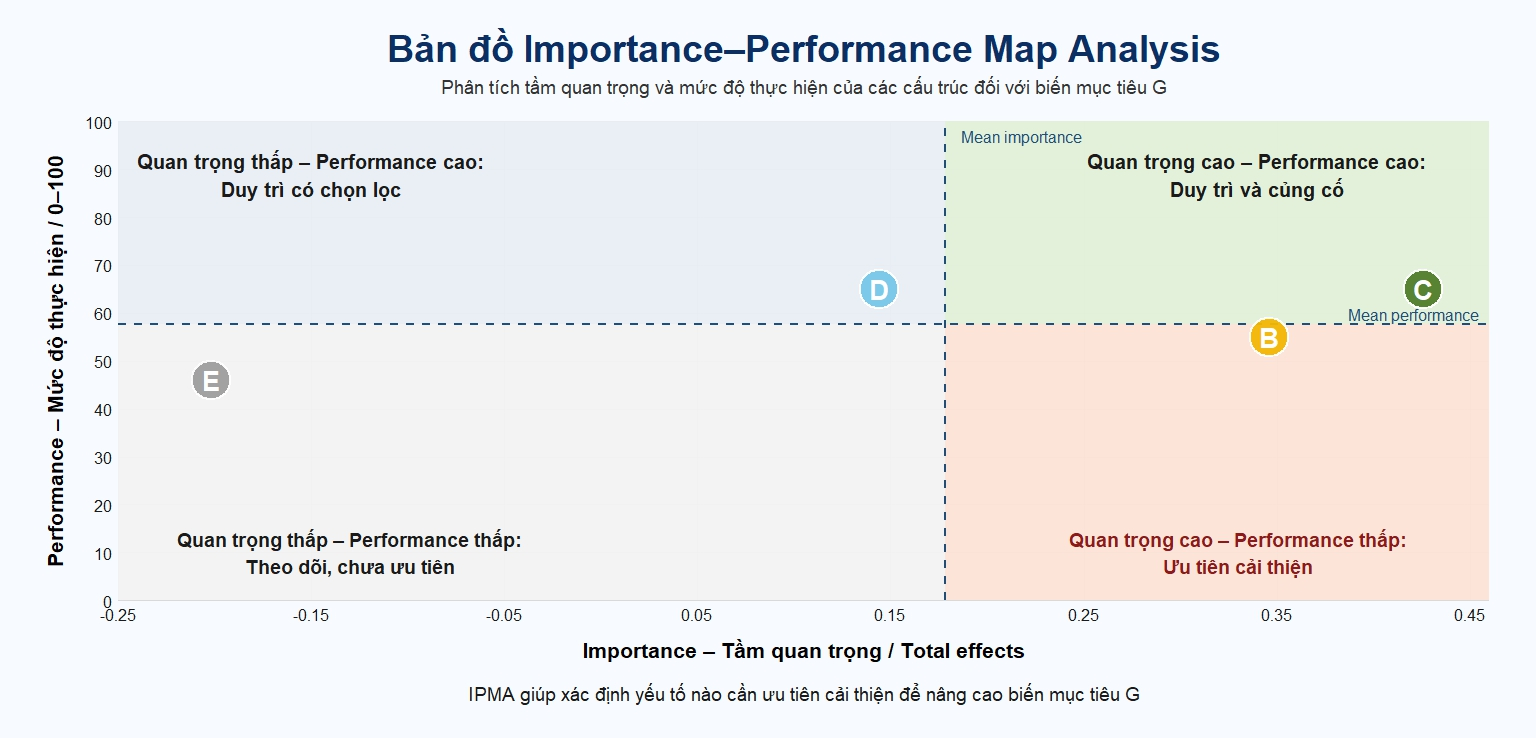
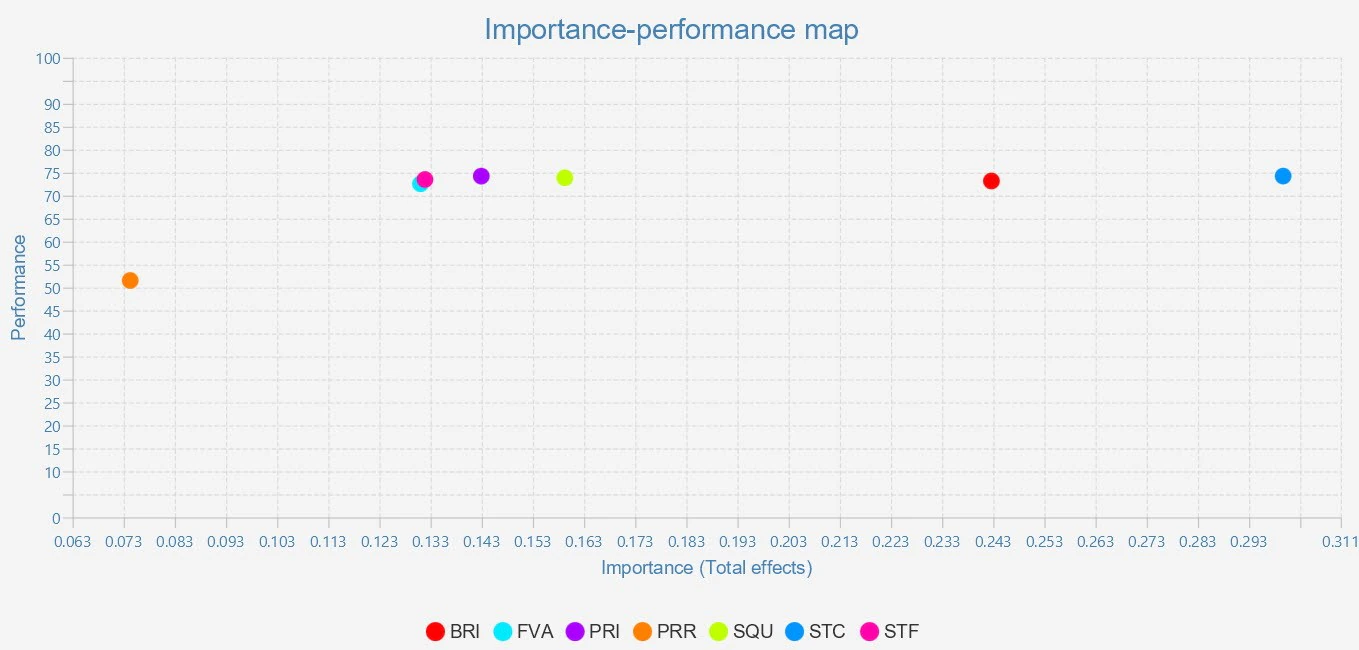
The mean lines in the supplied illustration are orientation aids for the displayed constructs, not universal quality thresholds. Adding a construct can move a mean line and change a point's quadrant without changing its coordinates. Retain the numerical table and the set of included predecessors (Hair et al., 2018, Chapter 3).
| Relative position | Decision to investigate | Unsupported shortcut |
|---|---|---|
| High importance, low performance | Is feasible improvement within the organization's control? | Automatically the most profitable investment |
| High importance, high performance | Which standards should be maintained? | Stop monitoring |
| Low importance, low performance | Are minimum obligations or particular groups affected? | The attribute is useless |
| Low importance, high performance | Can standards be maintained with suitable resources? | Resources are necessarily being wasted |
3. Prepare the data and check the requirements
Keep the data, specified model, item wording, codebook and model assessment report together. IPMA inherits the meaning and limitations of that model. It cannot repair invalid measurement, miscoded variables or unjustified structural paths (Hair et al., 2018, Chapter 3).
Rescaling requires numerical distances with a defensible interpretation. Industry codes 1, 2 and 3 do not represent increasing performance. Explain the treatment of Likert spacing and verify that higher scores represent more of the intended attribute. Distinguish a positively valued attribute from a burden such as risk or inconvenience (Hair et al., 2018, Chapter 3).
Inspect outer weights as well as loadings. Negative weights can reflect coding, specification or collinearity and compromise a monotonic interpretation of the score. Do not take absolute values, clip scores or delete items merely to obtain an attractive map. Investigate the item and model, document changes and repeat the assessment (Hair et al., 2018, Chapter 3).
Reverse items according to their meaning and the codebook. If a construct genuinely measures risk, retain its meaning and interpret the relationship direction. Do not reverse it simply to make every effect positive.
- Specify the target and decision first.
- Match theoretical item ranges to the codebook.
- Distinguish favorable attributes from adverse attributes such as cost or risk.
- Check reverse wording, negative weights and unresolved model problems.
- Record data, model and software versions.
4. Worked example: performance and total importance
Constructed example: three items on a theoretical 1–5 scale have means of 4.2, 3.4 and 3.8. Applying the rescaling formula in Hair et al. (2018, Chapter 3) gives item performance values of 80, 60 and 70. Keep the theoretical lower bound of 1 even if the sample's observed minimum is 2.
Suppose the weights have been converted to the appropriate units and normalized to sum to one: .20, .50 and .30. Construct performance is .20 × 80 + .50 × 60 + .30 × 70 = 67. Loadings cannot replace these weights, and equal weights cannot be assumed (Hair et al., 2018, Chapter 3).
Suppose X has a direct effect of .20 on Y and one indirect path through M with coefficients .40 and .50, all unstandardized on the compatible IPMA scale. Total importance is .20 + .40 × .50 = .40. Include every specified indirect path rather than selecting only statistically significant ones (Hair et al., 2018, Chapter 3).
P_item = 100 × (mean_item − min_theoretical) / (max_theoretical − min_theoretical)
P_X = 0.20 × 80 + 0.50 × 60 + 0.30 × 70 = 67
Importance(X → Y) = 0.20 + 0.40 × 0.50 = 0.40
Model-implied change in Y for +5 performance points in X = 5 × 0.40 = 2The calculation 5 × .40 = 2 describes the fitted linear relationship holding other factors constant. It does not demonstrate that an intervention will increase the outcome by two points or yield a particular financial return.
5. SmartPLS 4 workflow and outputs to retain
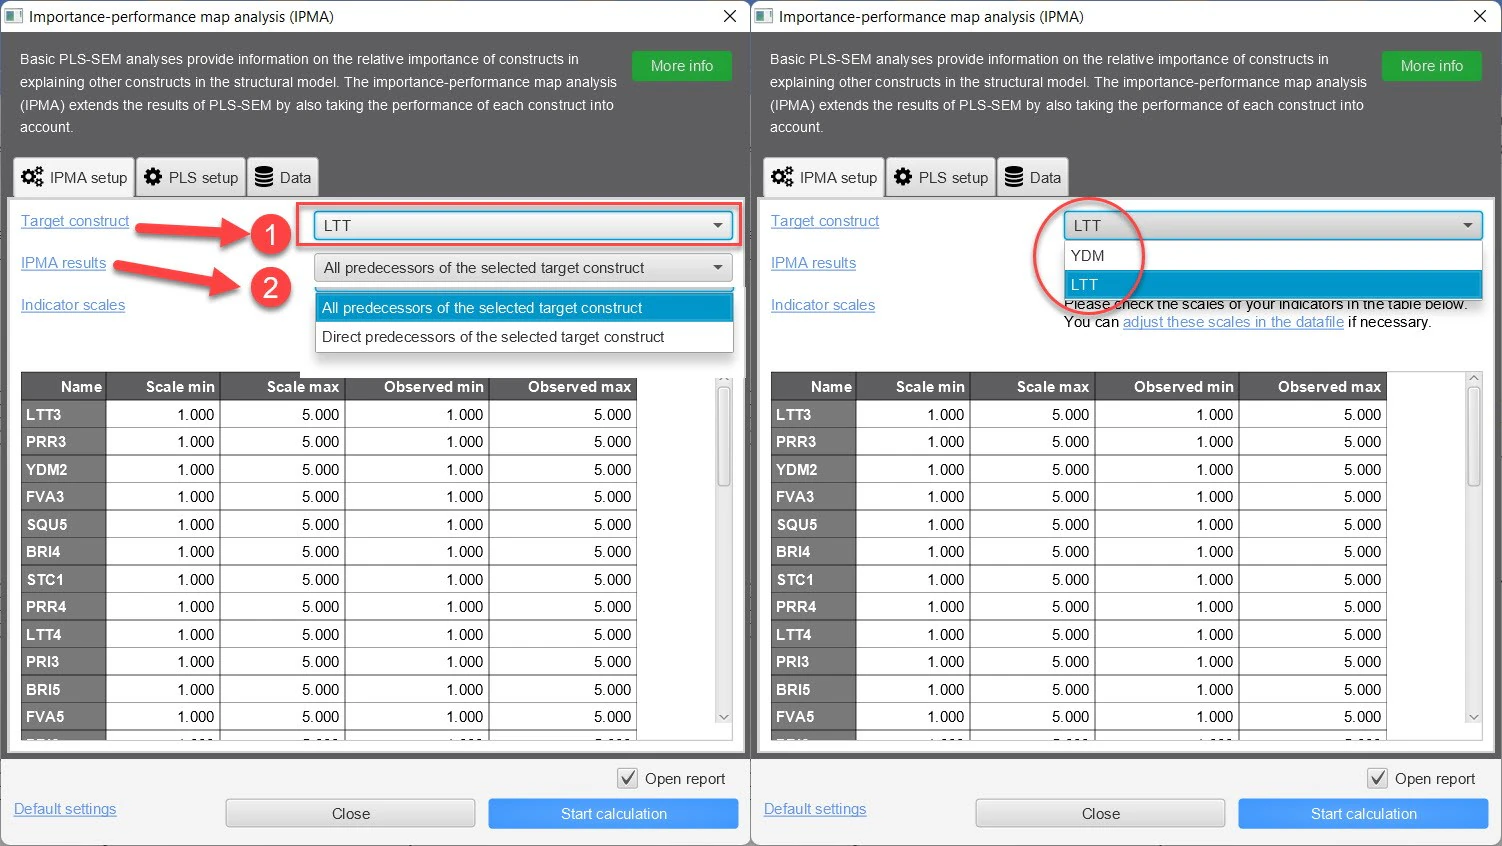
SmartPLS offers All predecessors and Direct predecessors. This controls which constructs appear on the map; it does not switch importance from total effects to direct effects. Record the scope when comparing maps (SmartPLS, n.d.).
Check the original model
Inspect measurement, structural results, weights and reverse coding. Resolve material coding or specification problems before running IPMA.
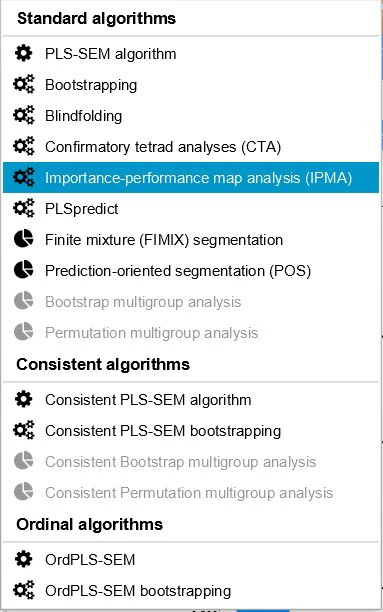
Open IPMA
Use Calculate and Importance-performance map analysis with the assessed data and model. Record the software version.
Choose the target
Select the construct tied to the intended decision and check that the comparison constructs are its predecessors.
Set predecessor scope
Choose all or direct predecessors as appropriate. Do not describe this as changing the type of importance coefficient.
Verify Ranges
Enter theoretical scale bounds from the codebook. A 1–7 scale remains 1–7 even when endpoint responses are absent.
Inspect the numerical results
Save the importance and performance table with its target. Check signs, units and unusual values before interpreting quadrants.
Examine indicators
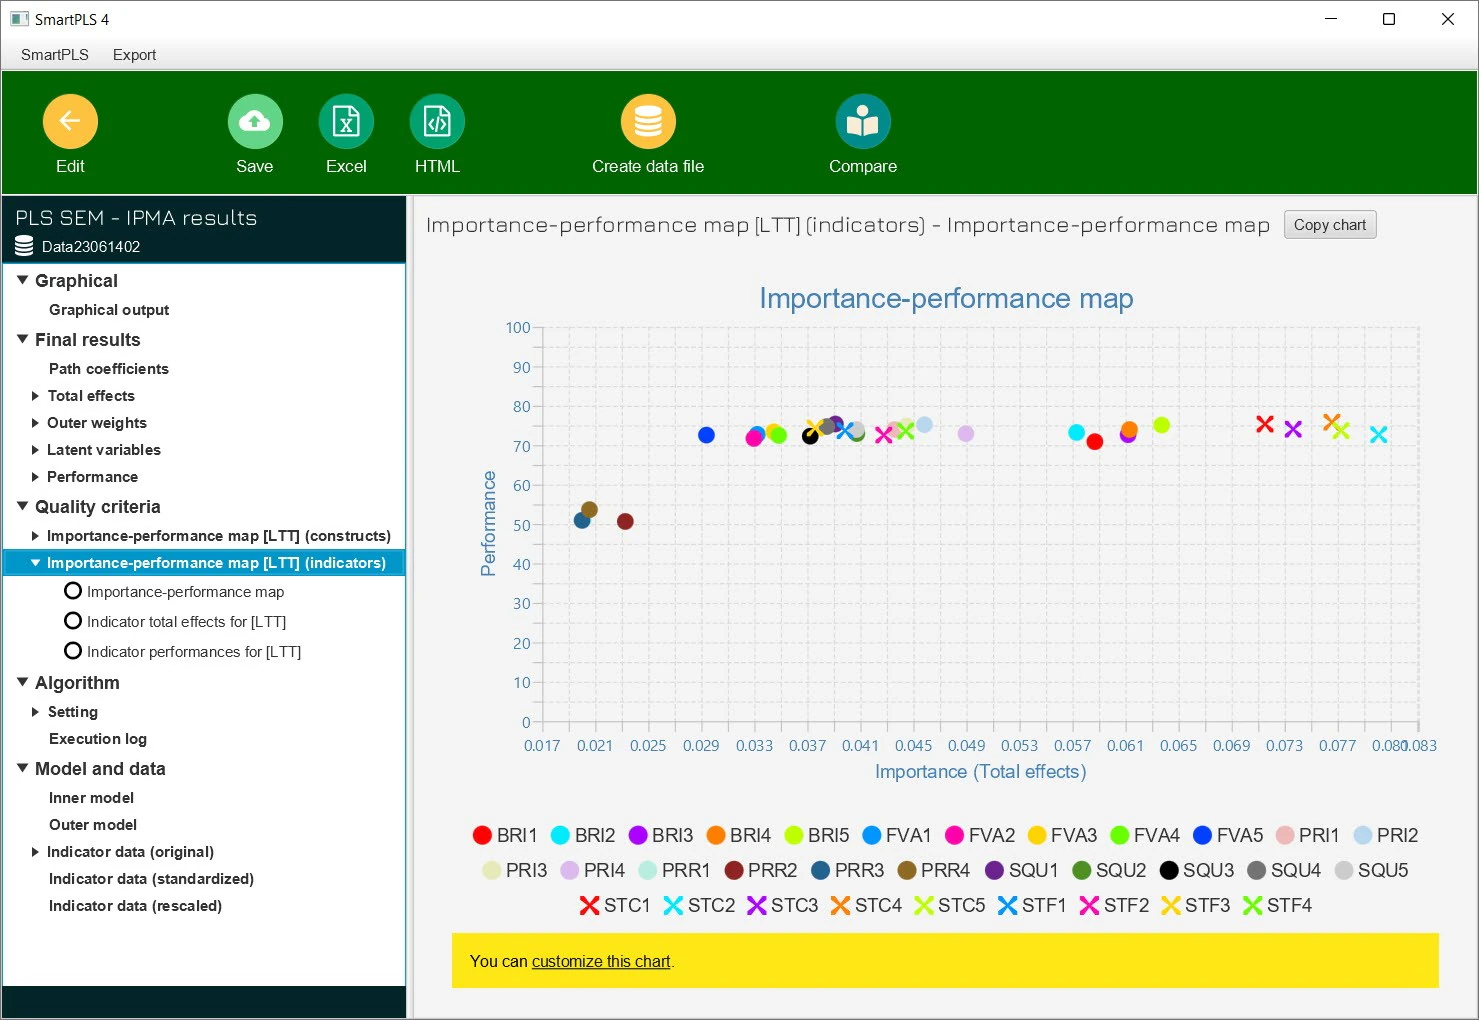
Inspect the item map for a priority construct, connect item codes to their wording and assess whether the underlying attribute is actionable.
Export the evidence
Retain the model report, IPMA results, codebook, target and ranges. Save any resampling or sensitivity settings and outputs separately.
6. Negative importance and the limits of indicator priorities
E in the supplied illustration has negative importance. Establish whether it measures a desirable attribute or a burden. If it measures risk, reducing rather than increasing it may be the relevant direction. An unexpected negative effect for quality requires checks of coding, collinearity, offsetting direct and indirect paths and uncertainty. A position on the left does not by itself establish irrelevance (Hair et al., 2018, Chapter 3).
Indicator importance combines a rescaled weight with the construct's unstandardized total effect. In the constructed example, the second item has importance .50 × .40 = .20. This describes the model's scoring relationship. In a reflective scale, changing an item's wording or inducing higher responses is not equivalent to improving the underlying service (Hair et al., 2018, Chapter 3).
| Observation | Check first |
|---|---|
| Unusual or out-of-range performance | Theoretical bounds, missing codes, reverse items and negative weights |
| Ranking differs from beta | Standardized versus unstandardized, direct versus total effects |
| A different target changes priorities | A different outcome is a different decision |
| An item is treated as a compulsory intervention | Item meaning, measurement type and actionable attributes |
7. Make priorities conditional on uncertainty and feasibility
Do not rank nearby estimates rigidly. Inspect resampling evidence for the correct parameter and scale. A standardized beta interval is not an interval for an unstandardized total effect. Check what the installed software actually outputs; if a corresponding interval is unavailable, report that limitation rather than inventing one.
Statistics and resource decisions are separate steps. High importance and low performance identify a candidate only when measurement is defensible, the relationship is sufficiently stable and the attribute can be changed. Costs, timing, feasible gains and risks are additional managerial judgments, not quantities automatically supplied by IPMA.
Assess sensitivity using substantively justified alternatives such as another target or defensible model specification. Keep the same numerical table when comparing maps. Deliberately incorrect scale bounds are coding errors, not legitimate robustness specifications.
| Candidate decision | Additional evidence |
|---|---|
| Improve | Relevant positive importance, room for improvement and examined uncertainty |
| Maintain | Good performance and a defensible maintenance requirement |
| Investigate further | Unexpected signs, unresolved measurement or missing interval evidence |
| Defer investment recommendation | Unclear feasibility or costs, without declaring the construct irrelevant |
8. Reporting template and reproducibility checklist
Replace the brackets below with actual findings. The numerical teaching example and supplied illustration are not evidence from your own study. Identify the predecessor scope, coding direction and unstandardized total effects explicitly (Hair et al., 2018; Ringle & Sarstedt, 2016).
Reporting template
IPMA was performed for [target] in SmartPLS [version], including [all/direct] predecessors. Theoretical item ranges and coding direction were checked against the codebook; performance was rescaled to 0–100. Importance represented unstandardized total effects. [X] had importance [ ] and performance [ ]. Uncertainty was assessed using [actual evidence, or describe its absence]. Considering [feasibility, costs and timing], [X] was treated as a candidate for [improvement/maintenance]. These priorities were not interpreted as causal intervention effects.
- Identify the target, predecessor scope and importance scale.
- Retain theoretical bounds, coding and missing-data decisions.
- Keep the numerical table alongside the map.
- Explain the reference lines without treating them as universal cutoffs.
- Discuss negative effects and the limits of item-level actions.
- Report uncertainty evidence or its absence.
- Retain the model, data version, settings and decision history.
Conclusion
A defensible IPMA connects an intended outcome, current performance and correctly scaled model relationships. Its conclusion should name candidate actions and the conditions that support them, rather than turn a quadrant into an automatic investment decision.
References
- Hair, J. F., Jr., Sarstedt, M., Ringle, C. M., & Gudergan, S. P. (2018). Advanced issues in partial least squares structural equation modeling. SAGE. Chapter 3, Importance-performance map analysis. https://us.sagepub.com/en-us/nam/advanced-issues-in-partial-least-squares-structural-equation-modeling/book243803
- Ringle, C. M., & Sarstedt, M. (2016). Gain more insight from your PLS-SEM results: The importance-performance map analysis. Industrial Management & Data Systems, 116(9), 1865–1886. https://doi.org/10.1108/IMDS-10-2015-0449
- SmartPLS. (n.d.). Importance-performance map analysis (IPMA). Online documentation, checked November 14, 2026. https://smartpls.com/documentation/algorithms-and-techniques/prediction-and-segmentation/ipma/
Methodological note: Constructed numerical examples are separate from owner-supplied figures. Calculations were checked against the complete 2018 textbook chapter and software settings against current documentation. IPMA differs from IPA based on self-reported importance.