
What Can JASP Do? An Analysis Map, Limitations, and Tool Selection
A suitably named analysis menu does not guarantee that software meets the actual research requirements. Researchers must check data structure, estimator, missing-data handling, diagnostics and required reporting outputs.
JASP offers many frequentist and Bayesian analyses through a graphical interface, from descriptives, group comparisons and regression to factor analysis, SEM, meta-analysis, survival and machine learning. Capabilities depend on version and module. Confirm suitability through Features, Release notes and a trial run on representative data.
1. Start with the research question, rather than the menu
JASP updates results as selections change and retains data, options and output in analysis files. This interface supports rapid review of decisions, but a ribbon procedure name does not establish whether its estimator, assumptions or data handling are suitable (Love et al., 2019).
Before choosing software, list the required outputs. A study might need coefficient estimates with confidence intervals, model comparisons, corrected standard errors, out-of-sample predictions or analysis of nested data. These requirements are more precise than asking generally whether software can run SEM.
JASP is suitable when its module offers the correct model and users can verify choices in the output. Switch tools when a core requirement is unsupported or poorly documented. Do not alter the research question merely to fit a menu.
A suitable tool supports the prespecified model, estimator, data structure, diagnostics and outputs.
2. Confirm versions, modules and changes across releases
Read interface images alongside their version numbers. The illustrated installation is JASP 0.98, while Release notes list JASP 0.99.0, released on 21/10/2026. Version 0.98.8 added interaction plots and reference lines, whereas 0.99.0 focused on several bug fixes. This information was checked on 26/10/2026 (JASP, 2026).
A newer version does not automatically invalidate an earlier analysis. It indicates a need to review changes, fixed bugs and file compatibility. During an ongoing project, freeze a version for an analysis cycle, record run dates and read Release notes before upgrading.
JASP 0.98.0 introduced JASP AI, an assistant able to call OpenAI API-compatible models and perform analyses through natural language. Assistant-generated results still require the same checks as other operations. Do not send identifying data to external services without an appropriate legal basis, participant consent and security configuration (JASP, 2026).
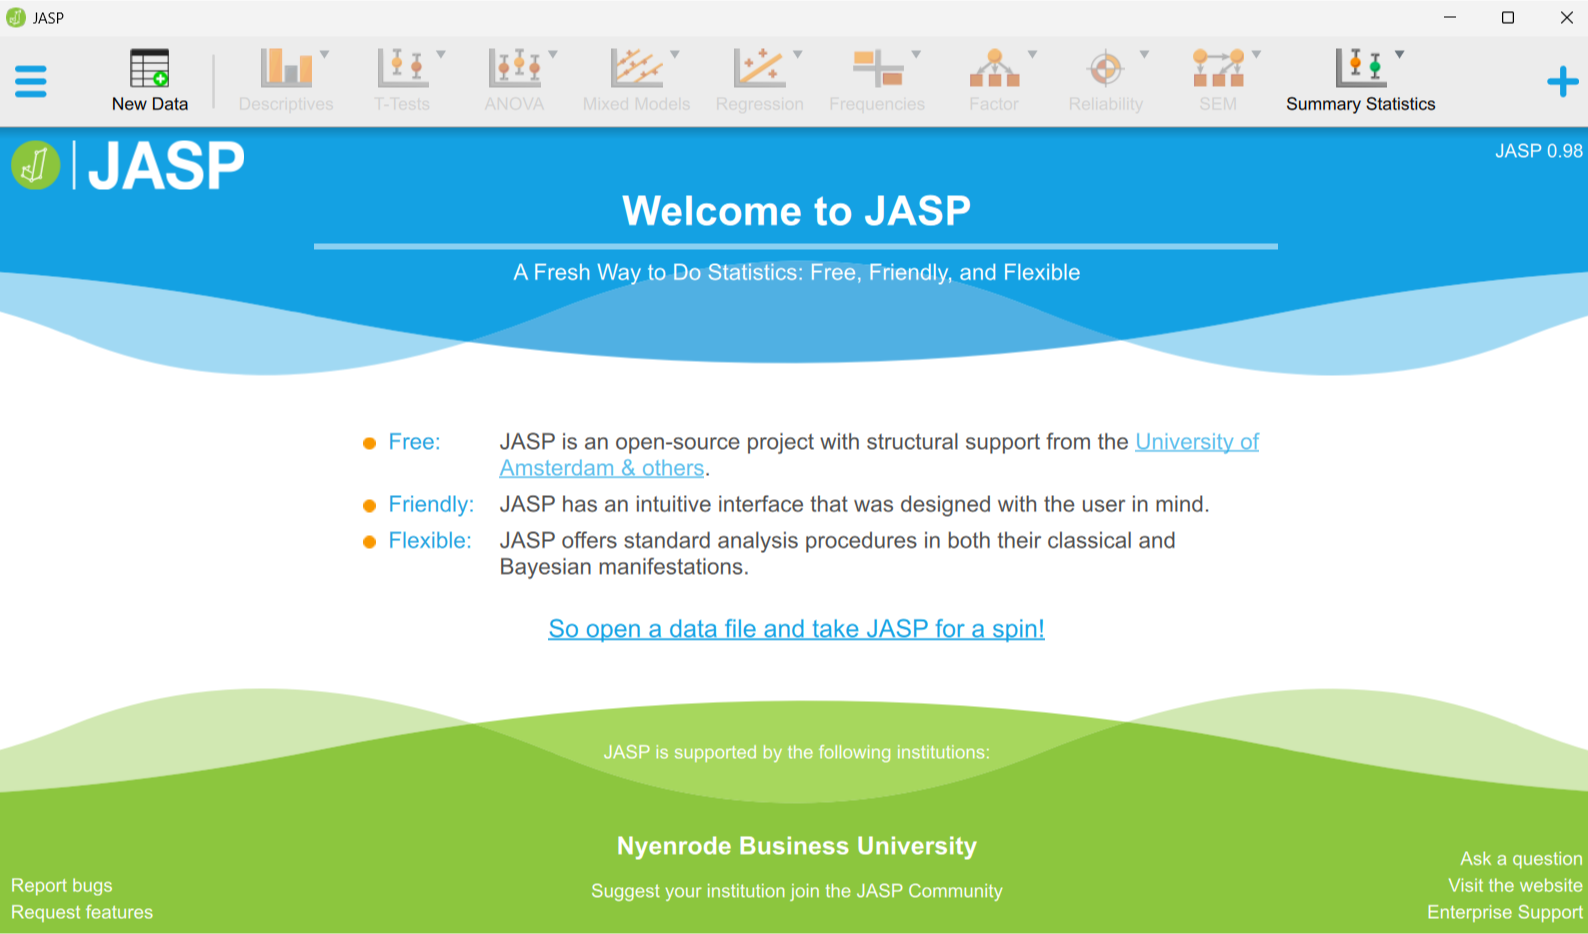
- Open About JASP and record the full version.
- Confirm that required modules are enabled.
- Read the relevant Release notes entries.
- Test a representative file before broad upgrades.
- Record the version, run date and operating system.
3. A map of JASP analysis groups
The Features page lists core Descriptives, T-Tests, ANOVA, Mixed Models, Regression, Frequencies and Factor groups. Extensions include Reliability, SEM, Meta-Analysis, Network, Survival, Time Series, Machine Learning, Quality Control and other areas (JASP, n.d.).
The map below groups functions by research question rather than button position. This distinguishes description, comparison, explanation, measurement and prediction. A study may use several groups, each requiring its own inputs and assumptions.
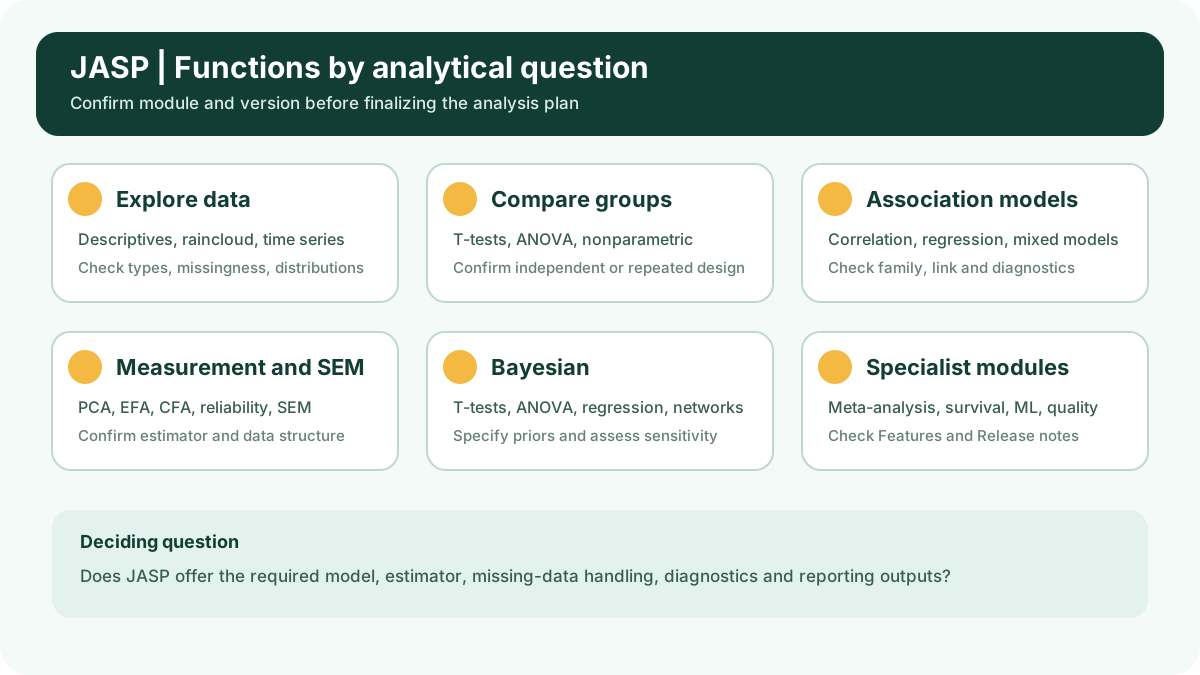
| Question | JASP groups to consider | Outputs to check | Limitation to examine |
|---|---|---|---|
| How are the data distributed? | Descriptives, plots | Valid N, missingness, location, spread and plots | Are types and missing codes correct? |
| How do two or more groups differ? | T-Tests, ANOVA, nonparametric | Effect size, CI and diagnostics | Independent, repeated or covariate-adjusted design? |
| How are variables associated? | Correlation, Regression, Mixed Models | Coefficients, CIs, residuals and predictions | Which family and link does the outcome require? |
| What structure does the scale have? | PCA, EFA, CFA, Reliability | Loadings, fit, residuals and reliability | How are ordinal data and estimators handled? |
| Is the latent-variable model appropriate? | SEM, mediation, latent growth | Parameters, fit, CIs and indirect effects | Are multilevel structure, weights or complex missingness present? |
| Is Bayesian evidence needed? | Corresponding Bayesian modules | Priors, BFs or posteriors, robustness | Are conclusions sensitive to priors? |
4. Frequentist and Bayesian inference follow different logics
JASP places many frequentist and Bayesian analyses side by side. Their interface proximity does not make their results equivalent. P-values are calculated under stated hypotheses and models; Bayes factors compare hypotheses' predictive performance under specified priors; credible intervals describe posterior distributions.
Do not use Bayes factors as renamed p-values. A Bayesian plan should specify hypotheses, priors, test direction, sensitivity analyses and reporting. The JASP guidelines by van Doorn et al. (2021) organize work into planning, execution, interpretation and reporting.
When using both frameworks, explain each analysis's role. Do not choose the more favorable result after inspecting data. Retain priors, robustness checks and manuscript outputs in the .jasp file.
| Component | Frequentist | Bayesian | Verification question |
|---|---|---|---|
| Testing evidence | P-value under the hypothesis and design | Bayes factor comparing models or hypotheses | Were hypotheses specified beforehand? |
| Estimation | Estimate and confidence interval | Posterior and credible interval | Is the interval interpreted under the correct logic? |
| Additional assumptions | Sampling model and repeated-sampling procedure | Prior and sampling model | Which choices affect conclusions? |
| Reporting | Effect size, CI, p and diagnostics | Prior, BF or posterior, and robustness | Can the analysis file reproduce results? |
5. Data, missingness and reproducibility
Drag-and-drop interfaces do not remove data management requirements. Retain unchanged raw data, a codebook, variable-creation rules, missing codes and correction logs. Goss-Sampson (2025) explains variable types, analysis selection and output interpretation, but cleaning decisions require documentation outside menus.
The .jasp file stores data with analyses so others can review options. Love et al. (2019) identify interface-based analysis inspection as a JASP design feature. The file does not replace raw data, variable-creation scripts or explanations for corrected observations.
Check filters and computed columns particularly carefully. Active filters may reduce N unnoticed; scale scores may be calculated from too few valid items. Record formulas, applicability conditions and excluded case counts.
Freeze input data
Keep read-only raw data and create derived analysis copies.
Check the schema
Match names, measurement types, value ranges and missingness to the codebook.
Document transformations
Retain computed-column formulas, filters and exclusion rules.
Save versioned JASP files
Use dated or versioned filenames and preserve reported analysis cycles.
Reopen and verify
Close and reopen the file to confirm output still uses the correct data.
6. Factor analysis, reliability and SEM: a module alone is insufficient
Features lists PCA, EFA and CFA under Factor; Reliability includes unidimensional reliability, ICC, rater agreement and Bland-Altman; SEM includes structural equation modeling, PLS-SEM, mediation, latent growth and other analyses (JASP, n.d.). Despite this breadth, match model requirements against actual options.
The key question is whether the estimator suits the data. Few-category ordinal items, multilevel data, complex survey weights, missingness requiring modeling or specially constrained models may need functions absent from the current module.
A PLS-SEM menu does not establish equivalence to SmartPLS or a particular R package. Compare algorithms, bootstrap procedures, measurement criteria, composite treatment and prediction outputs before using tools for cross-checking.
| Requirement | Confirm in JASP | If unconfirmed |
|---|---|---|
| Indicator type | Continuous, ordinal, nominal or composite | Do not force variables into scale type to unlock menus |
| Estimator | Estimator name and distributional assumptions | Switch to a clearly documented tool |
| Missing | Listwise, pairwise, FIML or another mechanism | Do not let defaults replace the plan |
| Sample structure | Independent, nested, weighted or longitudinal | Choose a model supporting that structure |
| Diagnostics | Residuals, fit, influence and convergence | Do not report a single fit index |
| Reproducibility | Module version, options and output | Retain evidence before switching tools |
An available option establishes only that JASP can run a procedure. Its appropriateness requires support from design, data and methodological literature.
7. Specialist modules and checking their scope
JASP has modules for meta-analysis, network analysis, survival, time series, machine learning, quality control, auditing and other topics. Meta-Analysis includes classical and Bayesian options; Survival offers nonparametric, semiparametric and parametric models; Time Series lists descriptives, stationarity, ARIMA and spectral analysis (JASP, n.d.).
This list changes faster than teaching materials. Consult Features for published modules and Release notes for recent changes. Older manuals remain useful for principles, although menu images and options may no longer match.
For less familiar modules, run an example with known results and compare against methodological documentation or other software. This checks implementation rather than seeking two numerically identical outputs.
| Module | Methodological question | Minimum output |
|---|---|---|
| Meta-Analysis | Which effect measure, heterogeneity and bias model? | Estimate, CI, tau-squared and diagnostics |
| Survival | Are censoring, time origin and proportional hazards appropriate? | Survival curve, effect, CI and diagnostics |
| Time Series | Is the series stationary, seasonal and sufficiently long? | ACF or PACF, residuals and forecasts |
| Machine Learning | Are prediction targets, validation and leakage controlled? | Out-of-sample metrics and uncertainty |
| Network | Are estimator, regularization and stability specified? | Network, accuracy/stability and limitations |
| Quality Control | Do sampling design and chart type fit the process? | Chart, limits and signal rules |
8. Five gates for deciding whether to use JASP
The workflow starts with the question and ends with reproducibility. Each gate requires concrete evidence, such as a manual entry, an option available in the installed version or trial-run results.
Do not wait until data cleaning and methods writing to discover a missing estimator. A technical pilot with representative variables can confirm data types, speed, output and table export before full-sample analysis.
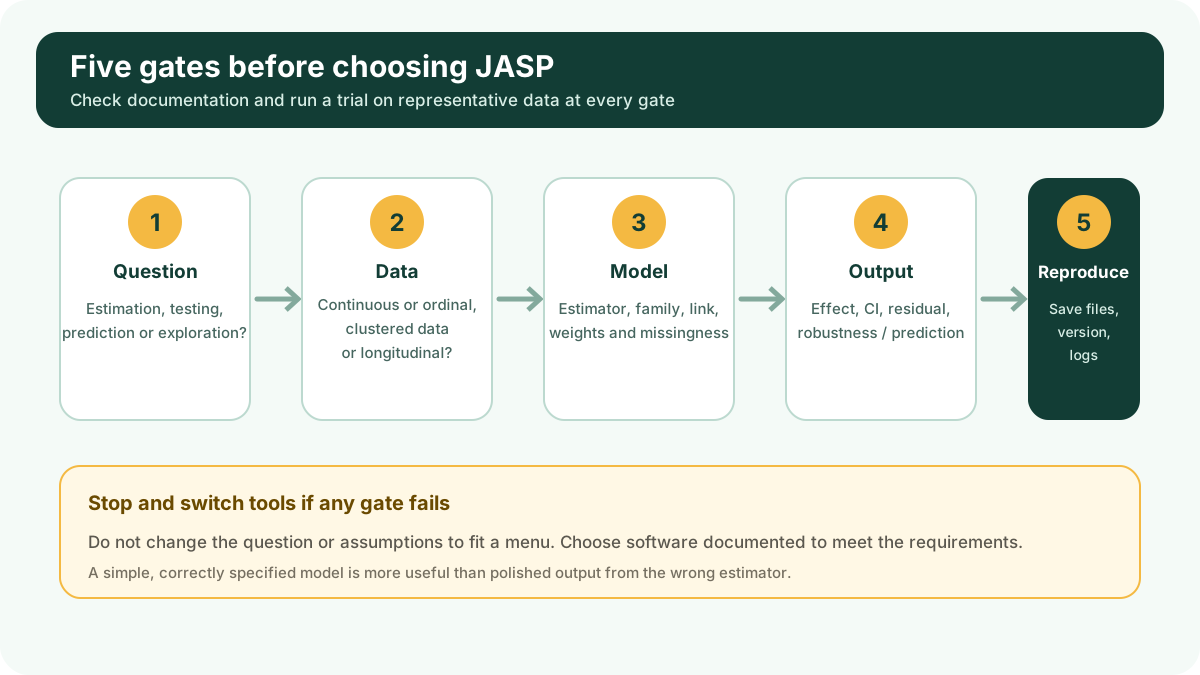
Gate 1: question
Identify whether the goal is description, estimation, testing, explanation or prediction.
Gate 2: data structure
Document outcomes, variable types, repeated measures, nesting, weights, missingness and time.
Gate 3: model
Confirm that estimator, family, link, priors or algorithm match the plan.
Gate 4: output
Check that effects, intervals, fit, residuals, robustness and predictions are available.
Gate 5: reproducibility
Ensure files, versions, options and derived data can be handed over.
9. Four practical tool-selection scenarios
These scenarios illustrate decisions rather than rank software. Conclusions apply only when the actual version and module meet the stated requirements.
Other tools may be preferable for automated syntax, complex surveys, panel estimators, multilevel latent models or specialist PLS-SEM workflows. Reasons for switching should concern missing requirements rather than habit or brand preference.
| Scenario | JASP may fit when | Consider other tools when |
|---|---|---|
| Comparing two groups with a continuous outcome | The design, effect sizes, CIs and diagnostics are supported | Survey weights or complex dependence are required |
| CFA for Likert items | The estimator and ordinal treatment are verified | An estimator or correction is absent from the module |
| Meta-analysis | Required effect measures and bias diagnostics are supported | Specialist models or automated updating workflows are needed |
| PLS-SEM | Algorithms, bootstrap and reporting criteria match the plan | Required composite, prediction or extension methods are unsupported |
A short statement about estimator, data structure and outputs makes the decision open to critique before results are examined.
10. Step-by-step practice: check JASP before the full analysis
Use a representative file without identifying information. The goal is to demonstrate that the installed JASP version reads data correctly, runs the intended procedure and provides sufficient reporting evidence, rather than to produce attractive results.
Prepare a copy with approximately 20 to 50 rows, including at least an identifier, grouping variable, ordinal variable and scale variable. Without suitable data, use JASP's Data Library and choose a dataset appropriate to the procedure. Record filename, practice date and analytical question on the check sheet.
Follow the steps in order. After each step, retain brief evidence such as an anonymized screenshot, option name or log note. If a gate fails, correct the data or switch tools before analyzing the full sample.
| Stage | Action | Required evidence | If unsuccessful |
|---|---|---|---|
| Environment | About JASP and modules | Version, run date and enabled modules | Update the protocol or install the correct module |
| Data | Open file and check columns | Rows, columns, types and missingness match the codebook | Stop to correct the derived data |
| Procedure | Select analysis and variables | Variable roles, estimator or family match the plan | Change settings or tools |
| Results | Enable required output | Required estimates, intervals and diagnostics appear | Do not use the results for conclusions |
| Reproducibility | Save, close and reopen | .jasp retains correct data, options and output | Check save errors or version management |
Step 1. Record the version
Open About JASP and copy the full version and software citation. Check Release notes if it differs from instructional screenshots.
Step 2. Enable the correct module
Click the plus at the toolbar's end, check required modules and enable those relevant to the analysis plan.
Step 3. Open representative data
Open an anonymized copy or Data Library dataset. Match rows, columns, names and initial values against the codebook.
Step 4. Confirm variable types
Click the icon beside each column name and check nominal, ordinal or scale. Do not change types merely to enable an analysis button.
Step 5. Run the minimum procedure
Open the planned analysis group, place variables in the correct boxes and use simple settings. For screening, begin with Descriptives to inspect Valid, Missing, Minimum and Maximum.
Step 6. Enable required outputs
Select estimates, intervals, effect sizes, model fit, residuals or diagnostics according to the protocol. Do not select options unrelated to the question.
Step 7. Read warnings before numbers
Check errors, convergence, actual N and excluded cases. A generated table does not establish correct execution.
Step 8. Apply Pass, Stop or Change tool criteria
Pass when model, data, estimator, diagnostics and outputs fit. Stop when data or specifications need correction. Change tool when JASP lacks a core requirement.
Step 9. Save and reopen
Save a versioned .jasp file, close the application, reopen the file and confirm retention of data, options and output.
Do not ignore warnings to continue collecting tables. Record the exact warning, identify its triggering step and proceed only after understanding its effect on estimation.
11. 15-minute exercise and recording template
Use Data Library or an anonymized data copy. Choose a simple question, such as describing one scale variable by group. Complete all nine steps, including type, valid-N and warning checks.
After completion, explain the choice of analysis group, which outputs support the answer and which limitations remain. Producing a table without explaining these three points does not complete the exercise.
Screenshots should show the relevant operation and output. Crop filenames, paths, IDs, emails and individual records. Captions should direct attention to relevant evidence rather than simply name the screen.
A complete exercise lets readers repeat the operations, understand each reported output and recognize when to stop or switch tools.
Example reporting paragraph
A technical check was performed in JASP [version] using a representative dataset of [N] cases. Variable [name] was declared [nominal/ordinal/scale] according to the codebook. Procedure [name] provided [estimates, intervals and diagnostics]; there were [no/some] warnings affecting interpretation. JASP was [accepted/paused/replaced] because of [reason concerning model, data or output].
- State the analytical question in one sentence.
- Record the JASP version and module name.
- Verify rows, columns and variable types.
- Capture one anonymized operation screenshot.
- Capture one output screenshot and mark the relevant section.
- Record valid N and missing-data handling.
- State Pass, Stop or Change tool.
- Save and reopen the .jasp file.
- Write a brief report from actual output.
12. Record versions, cite software and hand over files
About JASP provides version details and citation guidance. For the release current at this article's update, JASP Team (2026), JASP 0.99.0 may be cited, but studies must substitute the version actually used (JASP Team, 2026).
Methods should state version, module, estimator and settings affecting results. Include a software reference; retain the .jasp file, codebook and data log in an appendix or internal repository.
An accessible interface does not reduce reporting requirements. Readers need to know which data entered the analysis, which procedures ran, which settings differed from defaults and which outputs support conclusions.

Example reporting paragraph
Analyses used JASP [version] (JASP Team, [year]) with module [name and version if available]. Model [name] used [estimator, family, link or prior] because of [data characteristics and objectives]. Missing data were handled using [ ]. Estimates were reported with [95% CIs or credible intervals], diagnostics [ ] and sensitivity analyses [ ]. The .jasp file, codebook and decision log were retained with the analysis version.
- Questions and required outputs were documented before software selection.
- JASP version and modules were confirmed.
- The estimator or algorithm matches data types.
- Missingness, weights, clustering and repeated measures were considered.
- Output includes effects, intervals, diagnostics and robustness.
- Frequentist and Bayesian results follow their respective interpretation logic.
- Instructional images contain no identifying data.
- .jasp files, codebook and logs were handed over.
- The software citation matches the version used.
Conclusion
JASP covers a broad analytical range and is particularly useful for seeing how each choice changes results. The interface's value lies in clarifying decisions while preserving attention to assumptions.
Choose JASP after passing five gates: question, data, model, output and reproducibility. Switching tools when a gate fails is a normal methodological decision.
References
- Goss-Sampson, M. A. (2025). Statistical analysis in JASP 0.19.3: A guide for students.https://jasp-stats.org/wp-content/uploads/2025/07/Statistical-Analysis-in-JASP-A-guide-for-students-2025.pdf
- JASP. (n.d.). Features.https://jasp-stats.org/features/
- JASP. (2026). Release notes.https://jasp-stats.org/release-notes/
- JASP Team. (2026). JASP (Version 0.99.0) [Computer software].https://jasp-stats.org/
- Love, J., Selker, R., Marsman, M., Jamil, T., Dropmann, D., Verhagen, J., Ly, A., Gronau, Q. F., Šmíra, M., Epskamp, S., Matzke, D., Wild, A., Knight, P., Rouder, J. N., Morey, R. D., & Wagenmakers, E.-J. (2019). JASP: Graphical statistical software for common statistical designs. Journal of Statistical Software, 88(2), 1-17.https://doi.org/10.18637/jss.v088.i02
- van Doorn, J., van den Bergh, D., Böhm, U., Dablander, F., Derks, K., Draws, T., Etz, A., Evans, N. J., Gronau, Q. F., Haaf, J. M., Hinne, M., Kucharský, Š., Ly, A., Marsman, M., Matzke, D., Komarlu Narendra Gupta, A. R., Sarafoglou, A., Stefan, A., Voelkel, J. G., & Wagenmakers, E.-J. (2021). The JASP guidelines for conducting and reporting a Bayesian analysis. Psychonomic Bulletin & Review, 28(3), 813-826.https://doi.org/10.3758/s13423-020-01798-5
Academic note: Features change by version and module. This article was checked against Features and Release notes on 26/10/2026. Interface images show JASP 0.98; Release notes listed version 0.99.0 at the update date.