
Interpreting NCA Bottleneck Tables in SmartPLS Correctly
A bottleneck table identifies the minimum condition level associated with a target outcome level within the data range. It is not a formula guaranteeing success.
Read bottlenecks only after establishing support for necessity. Specify percentile or original scaling, the ceiling line, the meaning of NN and uncertainty in the threshold.
A necessary condition is not a sufficient condition
- Theory
Specify the proposed necessary condition
- Ceiling line
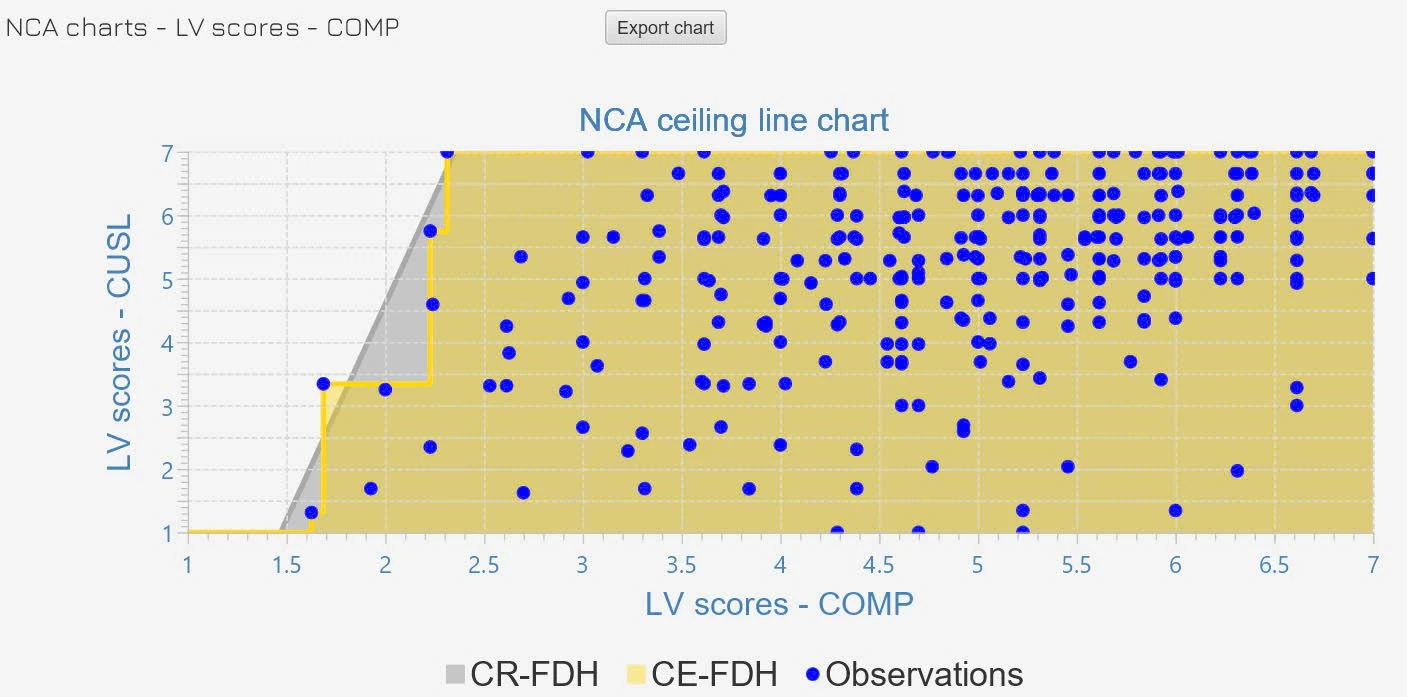
Inspect the empty space and ceiling
- Evidence
Effect size and appropriate testing
- Bottleneck
Read X required for a target Y
Conceptual diagram. Conclusions depend on data range and measurement.
Source: Lê Minh · Conceptual illustration, not software output.1. What does a bottleneck table answer?
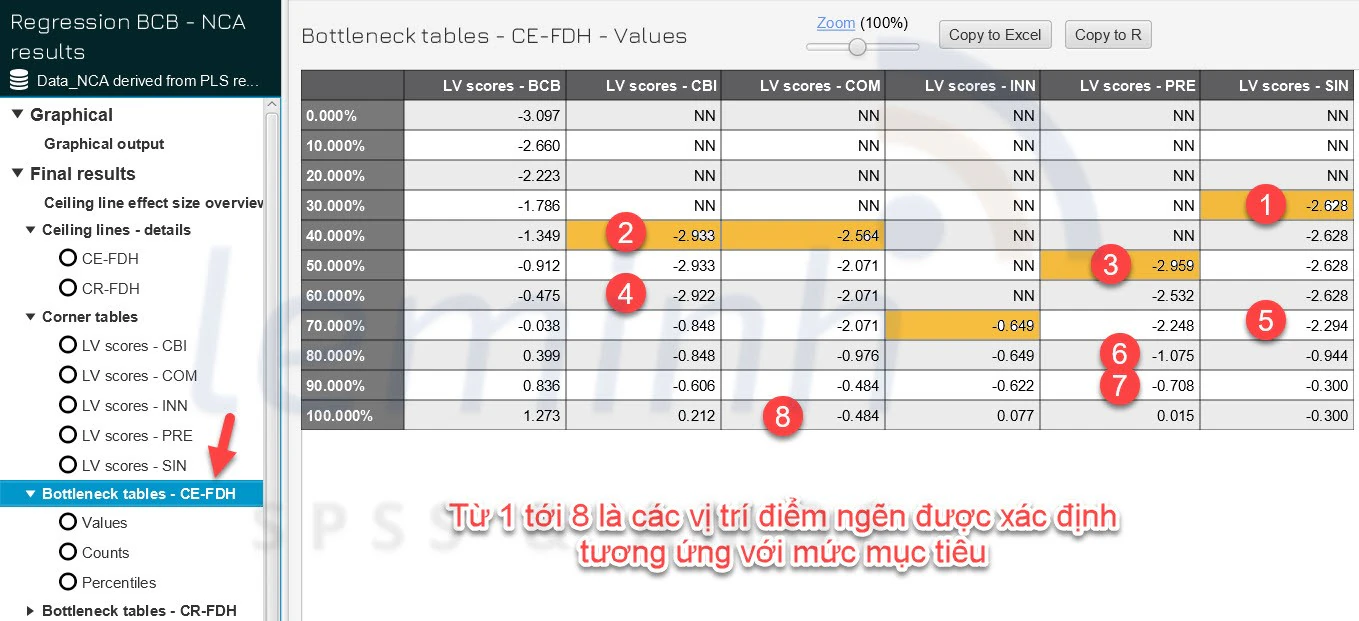
Each row specifies a target Y level; each column gives the minimum X needed for that Y level to remain feasible under the ceiling line (Dul, 2016).
NN usually means that no necessary restriction from that condition was observed at the outcome level considered. It does not mean the variable is unimportant in every model.
Exceeding a threshold removes one bottleneck. The outcome still depends on other necessary conditions, sufficient conditions and random factors.
2. Distinguish percentile and original scales
Before drawing conclusions, check whether SmartPLS displays percentages of the range or original units. When converting to original units, state the scale, coding direction and observed bounds.
| Scale | Advantages | Interpretation risks |
|---|---|---|
| Percentile | Facilitates comparisons between variables | Not directly a Likert score or real-world unit |
| Original scale | Closer to practical decisions | Depends on coding, min–max and sample range |
3. From results to recommendations
Screen conditions
Develop bottlenecks only for variables with convincing necessity logic, effect sizes and permutation evidence.
Choose a meaningful Y level
Do not default to 100%; choose a level linked to the research or managerial objective.
Read the intersection
Identify each X minimum at the exact target Y row.
Check the distribution
Assess whether sufficient observations support the threshold or a few points dominate it.
Write conditionally
Use necessity/feasibility language rather than guarantees.
4. Reporting template
Reporting example in English
For [Y] at [target] to remain feasible, the bottleneck table using [ceiling line] indicated a minimum [X1] of [ ] and [X2] of [ ] on the [percentile/original] scale. These are necessary thresholds within the sample, not sufficient levels or promises of achieving the outcome.
- State the selected outcome level.
- State the table’s scale.
- Explain NN correctly.
- Do not use the 100% row without justification.
- Check influential observations.
- Keep recommendations within the sample scope.
Conclusion
Bottleneck tables are most useful for translating valid NCA results into minimum-threshold statements. Their meaning depends on the ceiling line, scale and conditions of application.
References
- Dul, J. (2016). Necessary Condition Analysis. Organizational Research Methods, 19(1), 10–52.https://doi.org/10.1177/1094428115584005
- SmartPLS. (n.d.). Necessary Condition Analysis.https://smartpls.com/documentation/algorithms-and-techniques/nca/
Methodological note: Every bottleneck threshold is conditional on the sample, measurements and selected ceiling line.