
IPA and AIPA: turn attribute maps into defensible improvement priorities
An important attribute with weak performance may deserve attention. Its quadrant does not establish how much to invest, whether an intervention will improve satisfaction, or whether the result is stable across customer groups.
IPA organizes importance and performance. AIPA adds a question about asymmetry between poor and excellent performance. Report measurement, crosshairs, modeling choices and uncertainty before turning a map into recommendations.
From attribute assessment to improvement priorities
- Attributes
Define what is being assessed
- Importance
State how importance is obtained
- Performance
Read performance for each attribute
- Asymmetry
Consider gains and losses separately
Conceptual diagram. A map supports decisions; it does not establish causality.
Source: Lê Minh · Conceptual illustration, not software output.1. Define the ratings and the axes
Traditional IPA maps attribute importance against performance (Martilla & James, 1977). Define the respondent, service encounter, period and attribute before collecting ratings. “Response speed during the latest transaction” is more specific than “good service”.
Direct importance ratings and model-derived importance answer different questions. A regression coefficient should not be described as what customers explicitly rated as important when no such question was asked.
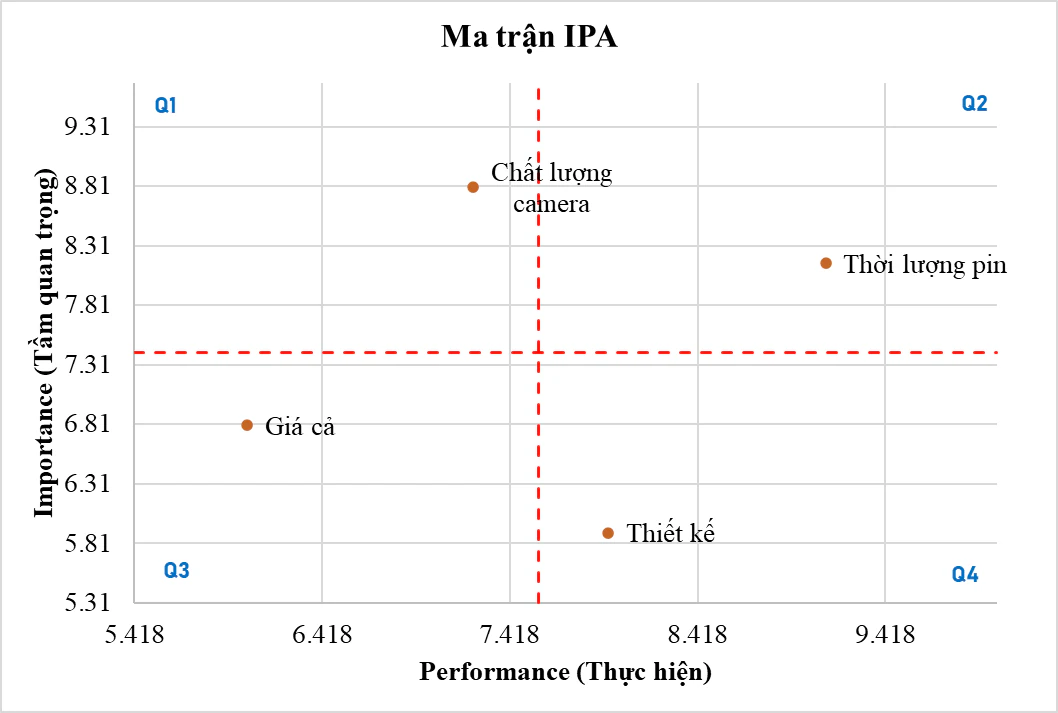
The original figure places performance horizontally and importance vertically. Other templates may reverse them. Read the labels rather than memorizing a quadrant’s position; export axis names, scoring direction and crosshairs with the chart.
2. Treat crosshairs as an analytical choice
Sample means give relative positions among attributes. A scale midpoint or service benchmark defines a different comparison. IPA categorization has methodological limitations (Sever, 2015). Specify the rule before viewing the results.
A contractual response-time standard should be examined directly rather than replaced by the average of unrelated attributes. A planned sensitivity analysis can compare defensible cut points, but show both maps rather than selecting the most persuasive one.
Near-boundary attributes can change quadrants through sampling variation. Report sample sizes, dispersion and appropriate intervals. Repeated responses within customers or sites require an analysis that respects dependence.
3. A hypothetical calculation before plotting
These invented 1–5 ratings teach the calculation. They are not the observations in the original figures or results from a client survey.
| Attribute | Importance | Performance | Interpretation under the chosen rule |
|---|---|---|---|
| Reliability | 4.6 | 3.1 | High importance, low performance |
| Speed | 4.2 | 3.7 | High importance, low performance; near boundary |
| Empathy | 3.8 | 4.2 | Relatively lower importance, high performance |
| Environment | 3.4 | 4.0 | Relatively lower importance, high performance |
Example: mean I = 4.0; mean P = (3.1 + 3.7 + 4.2 + 4.0)/4 = 3.75.
Reliability warrants investigation. Speed is only 0.05 below the performance crosshair, so its classification needs uncertainty assessment. High performance for the environment does not demonstrate waste: maintenance costs, safety and segment-specific needs still matter.
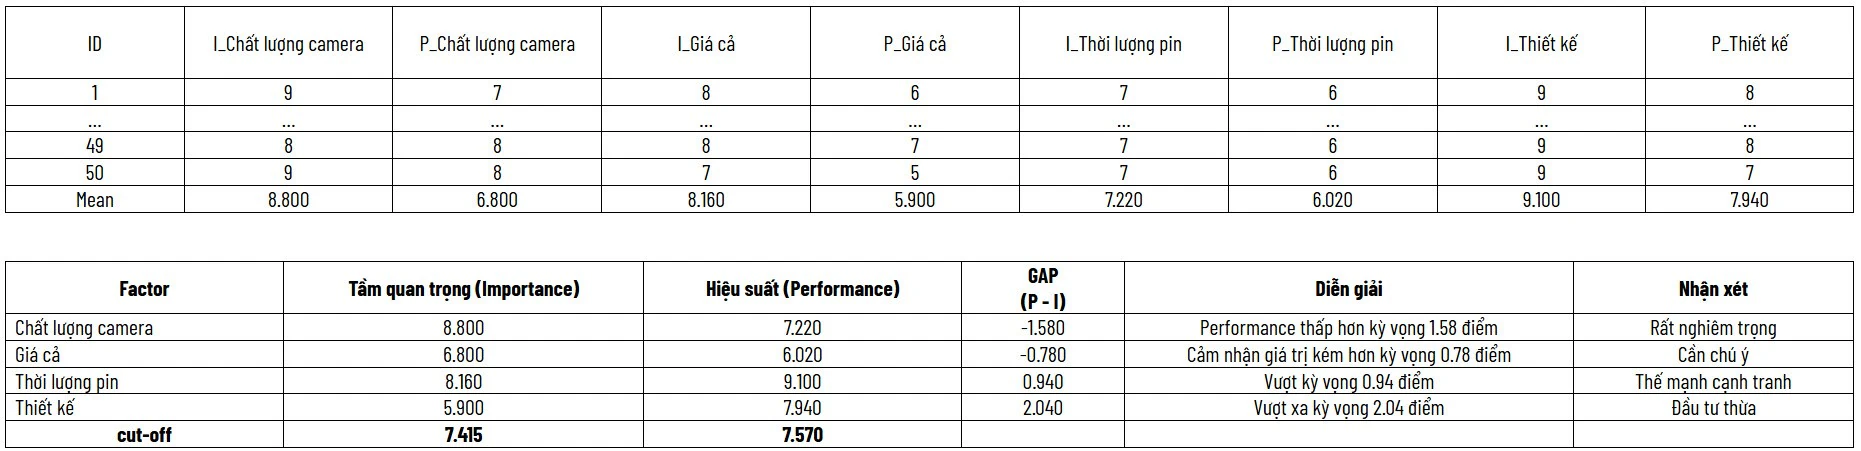
The source data image is retained as an authentic illustration. Do not combine the invented values in Table 1 with that image or attribute them to the original author.
4. Examine asymmetric associations
Here AIPA means an asymmetry-aware importance–performance approach, not one universally standardized algorithm. Impact-range and impact-asymmetry analysis consider associations that differ across attribute performance levels (Mikulić & Prebežac, 2008). Name the specific implementation.
A penalty–reward specification can define low, reference and high levels in advance, then model the outcome using low/high indicators for the attributes. In a jointly specified linear model, each coefficient compares an expected outcome with the reference category, holding included variables constant. These are conditional associations rather than automatically causal effects.
| Attribute | Low versus reference | High versus reference | Question |
|---|---|---|---|
| Reliability | −0.60 | +0.20 | Is poor performance associated with a larger penalty? |
| Speed | −0.40 | +0.40 | Are the two sides approximately symmetric? |
| An extra delight feature | −0.10 | +0.50 | Is excellent performance associated with a larger reward? |
No standard errors or intervals are supplied for these teaching numbers. They cannot establish asymmetry, definitive categories or a stable ranking. A nonsignificant coefficient also does not establish absence of a relationship.
Classification can change across segmentation criteria (Dueñas et al., 2021). Define groups through the research question, examine group information, and avoid selectively reporting whichever split produces the desired result.
5. Distinguish service IPA from PLS-SEM IPMA
In PLS-SEM IPMA, importance commonly uses total effects on a target and performance follows a defined score-rescaling procedure (Hair et al., 2022). These quantities are not equivalent to two direct ratings for each service attribute.
Report the target, item direction, theoretical scale endpoints and rescaling for IPMA. For direct IPA, report questions, anchors and aggregation. Shared labels do not make two importance measures interchangeable.
6. A reproducible workflow and report
- Define attributes, respondents and assessment timing.
- Identify direct or derived importance and any modeled outcome.
- Check missingness, distributions and coding direction.
- Declare crosshairs and planned sensitivity analyses.
- For AIPA, archive coding, reference groups, covariates and intervals.
- Assess costs, feasibility and operational evidence before acting.
Reporting template
IPA used [measurement] on [scale], aggregated at [level]. Crosshairs followed [rule], selected [when]. Attribute [ ] occupied [region], with uncertainty [ ]. AIPA using [implementation] estimated [association and CI]. Proposed action requires [operational evidence or follow-up design].
A useful map lets readers recover the underlying numbers and inspect the decision rule. Quadrants begin the management discussion; they do not automatically allocate resources.
References
- Dueñas, X., Rodríguez, M., & Pérez, L. M. (2021). Asymmetric importance-performance analysis: Measuring classification changes of destination attributes into basic, performance and excitement factors according to the segmentation criterion. Tourism and Hospitality Research, 21(4), 418–425. https://doi.org/10.1177/14673584211002603
- Hair, J. F., Jr., Hult, G. T. M., Ringle, C. M., & Sarstedt, M. (2022). A primer on partial least squares structural equation modeling (PLS-SEM) (3rd ed.). SAGE https://us2.sagepub.com/en-us/nam/a-primer-on-partial-least-squares-structural-equation-modeling-pls-sem/book270548
- Martilla, J. A., & James, J. C. (1977). Importance-performance analysis. Journal of Marketing, 41(1), 77–79. https://doi.org/10.1177/002224297704100112
- Mikulić, J., & Prebežac, D. (2008). Prioritizing improvement of service attributes using impact range-performance analysis and impact-asymmetry analysis. Managing Service Quality, 18(6), 559–576. https://doi.org/10.1108/09604520810920068
- Sever, I. (2015). Importance-performance analysis: A valid management tool?. Tourism Management, 48, 43–53. https://doi.org/10.1016/j.tourman.2014.10.022