
CR, AVE, and MSV in CFA Using AMOS: From Formulas to Reporting
CR, AVE, and MSV are meaningful only when calculated from a valid CFA solution. Correct formulas cannot rescue a misspecified model, abnormal factor loadings, or two constructs that are not substantively distinct.
A reliable workflow begins by checking the CFA solution, obtaining loadings and correlations from the same run, calculating CR and AVE for each construct and MSV from latent correlations, and comparing these with supplementary evidence rather than deciding from one threshold alone.
1. Learning Objectives and Prerequisites
After this guide, you should be able to retrieve the correct AMOS tables, calculate CR and AVE for each construct, construct an AVE–MSV matrix, identify common calculation errors, and write a verifiable results paragraph. The numerical example uses standardized loadings so readers can follow the calculations, but actual studies must retain the original output and calculation workbook.
The prerequisite is an identified CFA model with converged estimation and no improper solutions, such as negative error variances, implausible standardized loadings, or factor correlations above 1. If the CFA solution is invalid, stop before calculating composite indices (Brown, 2015).
- Assign each indicator to its construct according to the theoretical model.
- AMOS reports no identification or nonconvergence errors.
- There are no negative variances or impossible standardized loadings.
- Standardized loadings and factor correlations come from the same run.
- The indicator list used in calculations matches the final model.
- Model changes are documented and justified.
2. CR, AVE, and MSV Answer Three Different Questions
Composite reliability (CR) estimates the proportion of composite-score variance attributable to the common factor under the specified measurement model. Average variance extracted (AVE) describes the average proportion of indicator variance explained by the factor. Maximum shared variance (MSV) is the largest squared correlation between a factor and another factor in the same CFA model (Fornell and Larcker, 1981; Raykov, 1997).
CR is not identical to Cronbach’s alpha. Alpha relies on stronger assumptions about relationships among indicators, whereas CR uses loadings and errors from the CFA model. Both provide reliability evidence rather than independent proof of unidimensionality or content validity.
| Index | Assessment unit | Main question | Must not be interpreted as |
|---|---|---|---|
| CR | Each construct | How reliably does the indicator set produce scores? | Proof that the scale is unidimensional |
| AVE | Each construct | How much indicator variance does the factor explain on average? | Overall model fit |
| MSV | Each construct relative to its closest counterpart | What is the largest shared variance with another factor? | An independent pass/fail threshold |
3. Formulas and Their Underlying Assumptions
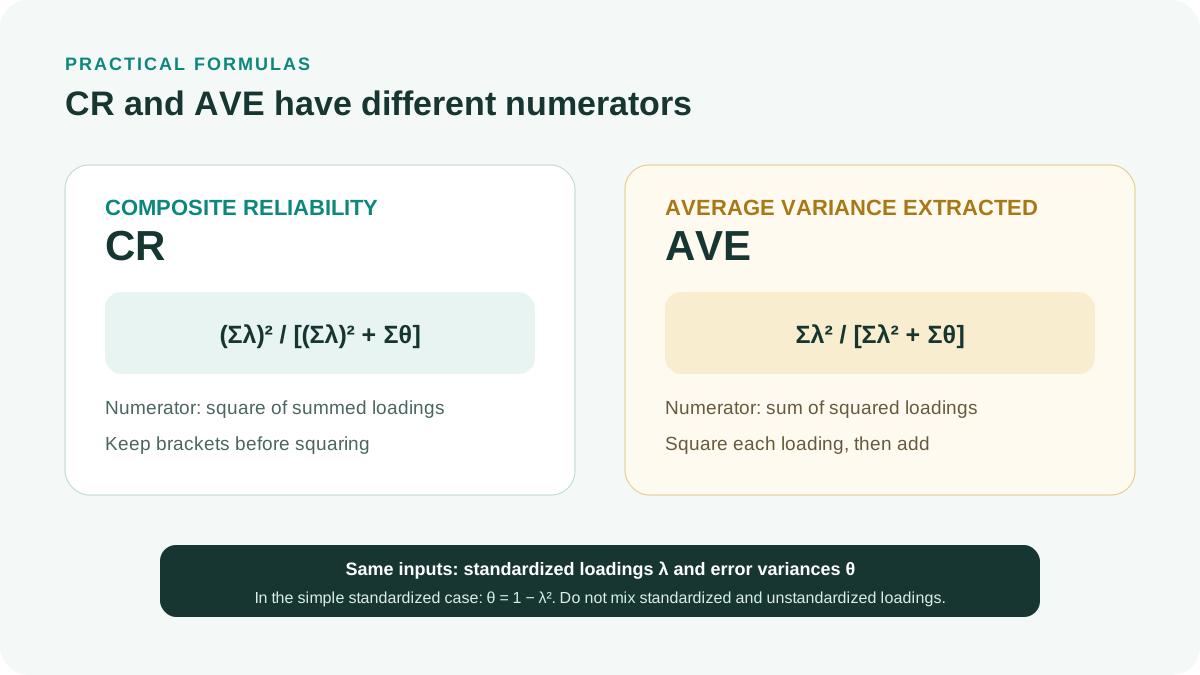
With standardized loadings lambda and error variances theta, common practical formulas are CR = (sum lambda)² / [(sum lambda)² + sum theta] and AVE = sum lambda² / [sum lambda² + sum theta]. When indicators are standardized and error specification is uncomplicated, theta can be calculated as 1 - lambda². MSV is the largest r², where r is the latent correlation between the focal construct and each other construct.
The simplified formulas assume a consistently standardized solution. With correlated errors, cross-loadings, or complex structures, estimate reliability directly from the model using unstandardized loadings, factor variances, and the error matrix. Raykov (1997) shows that model-based reliability estimation is more flexible than assuming equal loadings for all indicators.
Do not round loadings before squaring them. Retain at least four digits in the calculation workbook and round only the final reported values.
| Index | Input data | AMOS source | Precalculation check |
|---|---|---|---|
| CR | Loadings and error variances | Standardized Regression Weights and Variances | Correct indicators and CFA solution |
| AVE | Squared loadings and error variances | Standardized Regression Weights | Do not mix standardized and unstandardized loadings |
| MSV | Latent correlations | Correlations or Estimates | Do not substitute total-score correlations for factor correlations |
4. Retrieving the Correct Values from AMOS
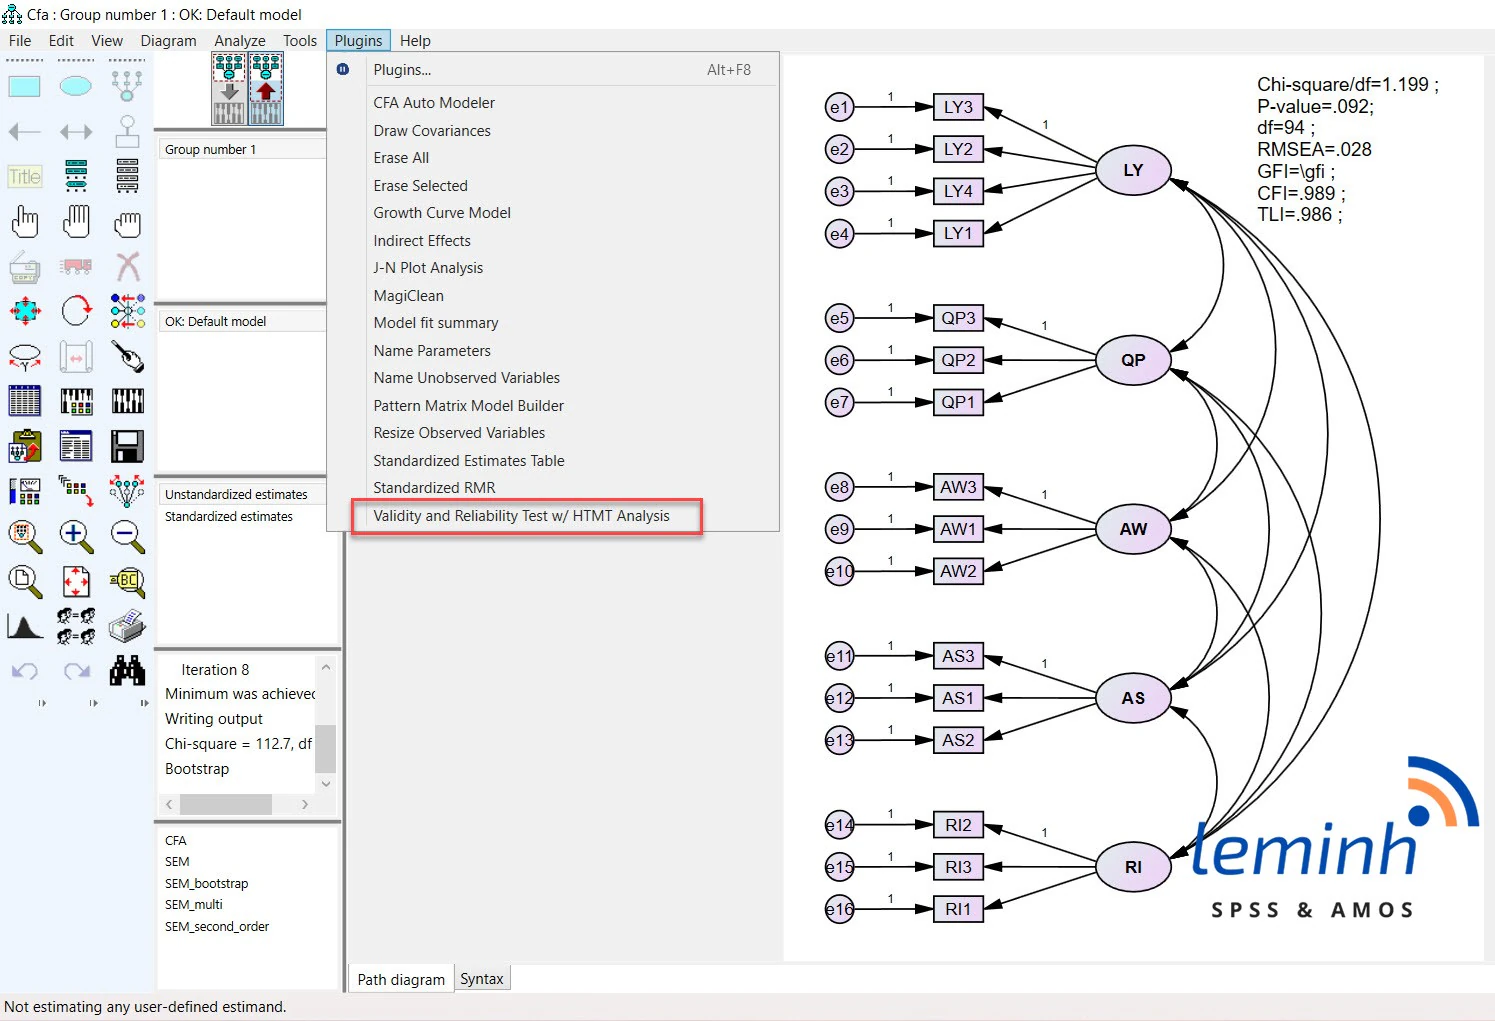
In IBM SPSS Amos 29, open Analysis Properties and enable Standardized estimates, Squared multiple correlations, and the required Estimates tables. After estimation, inspect Notes for Model, Regression Weights, Standardized Regression Weights, Variances, and Correlations. IBM Corp. (2022) describes these output options in the AMOS 29 guide.
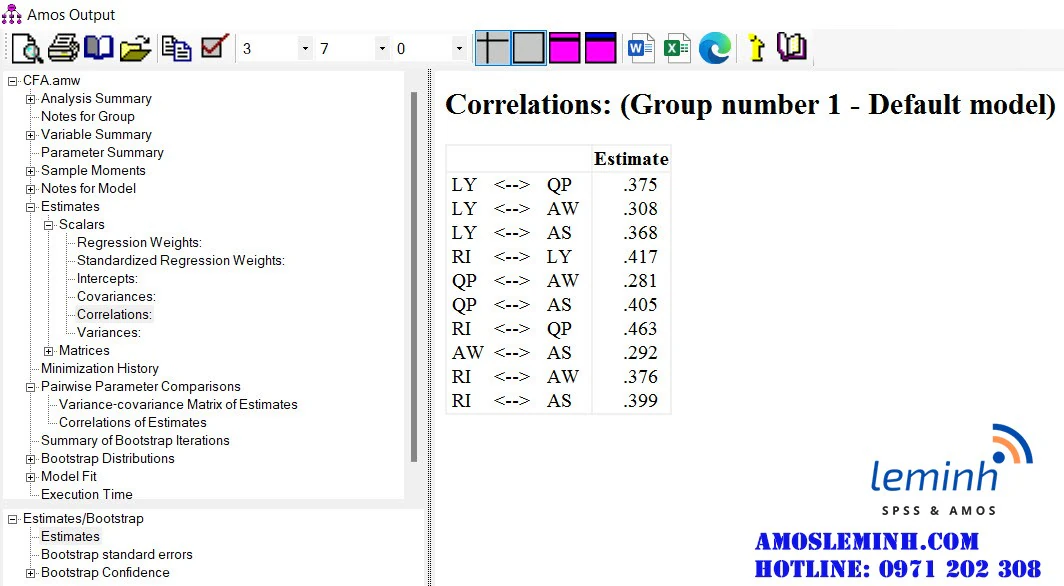
Standardized loadings appear in Standardized Regression Weights. Factor correlations appear when latent variables are connected by double-headed arrows. If the model uses unstandardized covariances, switch to Correlations before squaring values to calculate MSV.
Export the values to a workbook with columns for construct, indicator, lambda, lambda², and theta. Add a separate factor-correlation matrix. This structure makes every number traceable and prevents accidental copying between models.
Open Analysis Properties
Under Output, select Standardized estimates, Squared multiple correlations, and the required estimates tables.
Run CFA and read warnings
Verify convergence and the absence of negative variances, impossible loadings, or identification errors.
Copy standardized loadings
Retrieve each factor-to-indicator path from Standardized Regression Weights and assign it to the correct construct.
Calculate error variances
For a simple standardized solution, use theta = 1 - lambda²; for complex models, retrieve and standardize values according to the actual specification.
Copy factor correlations
Use Correlations rather than squaring unstandardized covariances.
Save a checking workbook
Record the model name, run date, AMOS version, and indicator list used.
5. Numerical Example: Calculating CR and AVE by Hand
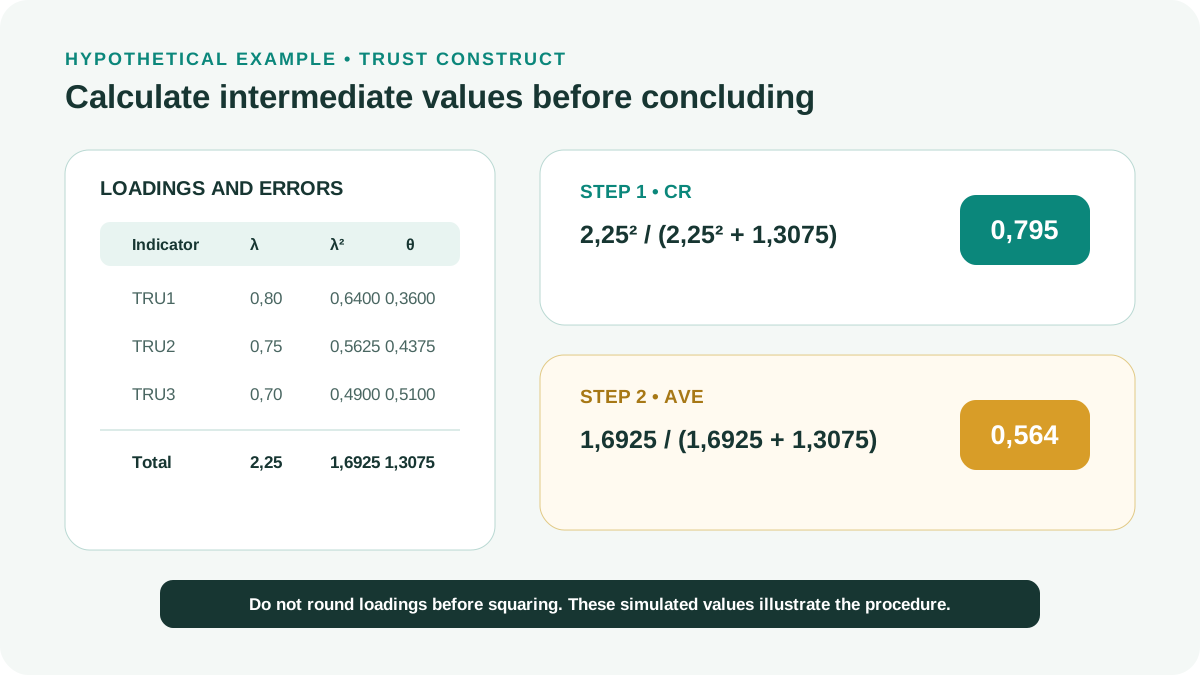
The example below is illustrative rather than actual research data. Suppose Trust has three indicators with standardized loadings of 0,80; 0,75; and 0,70. Their squared loadings are 0,6400; 0,5625; and 0,4900. Corresponding error variances are 0,3600; 0,4375; and 0,5100.
The sum of loadings is 2,25. CR = 2,25² / (2,25² + 1,3075) = 0,795. AVE = 1,6925 / (1,6925 + 1,3075) = 0,564. Composite reliability and convergent variance are at levels generally considered favorable, but final conclusions still require adequate model quality and scale content.
| Indicator | lambda | lambda² | theta = 1 - lambda² |
|---|---|---|---|
| TRU1 | 0,80 | 0,6400 | 0,3600 |
| TRU2 | 0,75 | 0,5625 | 0,4375 |
| TRU3 | 0,70 | 0,4900 | 0,5100 |
| Total | 2,25 | 1,6925 | 1,3075 |
CR uses the square of the sum of loadings; AVE uses the sum of squared loadings. Confusing the expressions is a common calculation error that can substantially distort CR.
6. Calculating MSV and Constructing a Discriminant Validity Matrix
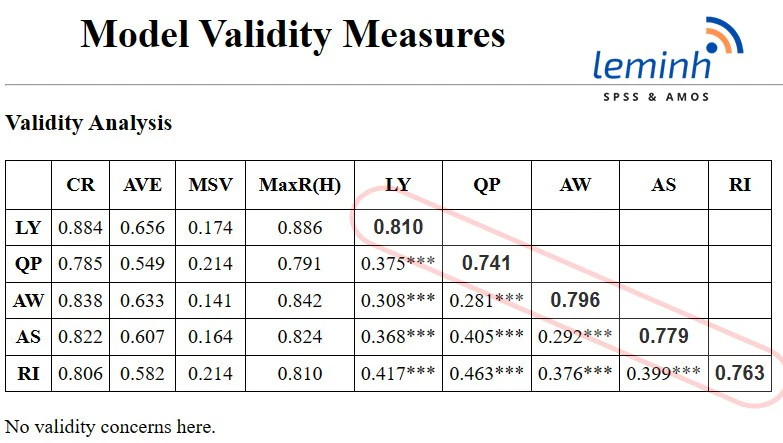
Continuing the example, suppose Trust correlates 0,62 with Satisfaction and 0,45 with Perceived Quality. The shared variances are 0,3844 and 0,2025, respectively, so Trust’s MSV is 0,3844. Because AVE = 0,564 exceeds MSV = 0,3844, the AVE–shared variance comparison criterion is supported for this construct.
The square root of AVE is 0,751. In a Fornell–Larcker matrix, this value is placed on the diagonal and compared with the absolute off-diagonal correlations. This presents the same logic that AVE exceeds squared correlations (Fornell and Larcker, 1981).
Each construct’s MSV may come from a different pair. Check the entire matrix rather than reporting one overall number for the model.
| Construct | CR | AVE | MSV | Trust | Satisfaction | Quality |
|---|---|---|---|---|---|---|
| Trust | 0,795 | 0,564 | 0,384 | 0,751 | ||
| Satisfaction | 0,842 | 0,640 | 0,384 | 0,620 | 0,800 | |
| Quality | 0,818 | 0,600 | 0,303 | 0,450 | 0,550 | 0,775 |
7. Use Thresholds as Guidance Rather Than an Automatic Scorecard
CR around 0,70 and AVE around 0,50 are commonly used practical guidelines (Fornell and Larcker, 1981; Kline, 2023). Values near these benchmarks do not create absolute scientific boundaries. Consider sample size, standard errors, indicator counts, loading strength, CFA fit, and conceptual content before retaining or removing a scale.
Very high CR is not always desirable. Indicators may duplicate content, narrowing the scale relative to the conceptual definition. Conversely, adequate CR with low AVE suggests that indicators may be consistent while convergent variance remains limited.
Do not remove indicators merely to push AVE above 0,50. Every removal requires justification based on item content, loading evidence, and its effect on the conceptual domain.
First check the CFA solution, individual indicator quality, and model fit. Only then interpret CR, AVE, and MSV. Composite indices are consequences of the measurement model, not tools for concealing an incorrect model.
8. Fornell–Larcker Is Not the Only Evidence
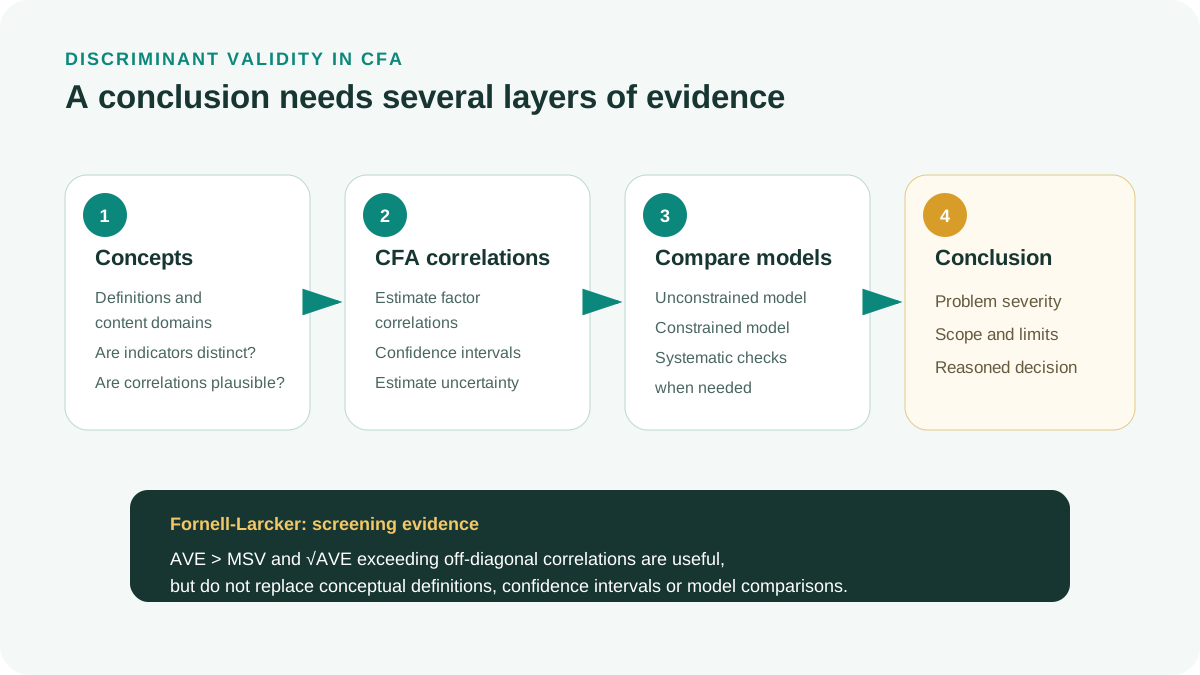
AVE exceeding MSV is a traditional check, but it should not independently establish that two constructs are unquestionably distinct. Rönkkö and Cho (2022) show that discriminant validity assessment should connect conceptual definitions, CFA correlations, confidence intervals, and constrained-model comparisons where appropriate.
For highly correlated factors, inspect the correlation’s confidence interval, test a model fixing the correlation at a theoretically meaningful value, examine cross-loadings or correlated errors, and compare indicator content. If the concepts are theoretically almost identical, another statistical test will not resolve the definitional problem.
HTMT can provide supplementary evidence in some workflows, but do not transfer PLS-SEM rules wholesale to CB-SEM without explaining the calculation and testing objective.
If two factors are insufficiently distinct, identify the cause: conceptual overlap, similarly worded items, common measurement methods, cross-loadings, or sample characteristics. Deleting items according to the highest index can improve apparent results while reducing content validity.
9. When Simplified CR Is Insufficient: Model-Based Reliability
CR calculated from standardized loadings is a convenient summary, but not always the best estimate for the actual score. With cross-loadings, correlated errors, unequal scoring weights, or multidimensional models, clearly identify the score being assessed and use the corresponding model to estimate reliability (Raykov, 1997; Kline, 2023).
In simple cases, CR and model-based omega often address the same question: the proportion of score variance explained by a common factor. McDonald (1999) presents omega within a factor-model-based reliability framework. The issue is therefore whether the formula matches the model and scoring method, rather than choosing a more modern-sounding name. Do not label every calculation from factor loadings omega without specifying its form and assumptions.
If the model permits correlated errors, substituting 1 minus lambda squared for theta may omit error covariances. In that case, calculate reliability directly from the model’s parameter matrix or use software with CFA-based reliability estimation, and explicitly report the method.
| Situation | Appropriate approach | Details to disclose |
|---|---|---|
| One factor, congeneric indicators, no correlated errors | CR or omega based on loadings and errors | Loadings, errors, formula, and source model |
| Correlated errors | Reliability from the complete parameter matrix | Error pairs, covariances, and calculation method |
| Cross-loadings or multiple factors | Reliability for the correct target score | Total or subscale score, scoring weights |
| Comparisons across groups or time points | Assess invariance before comparing scores | Invariance level and interpretive limitations |
CR can be high when items duplicate content or share wording effects. Always interpret CR alongside factor structure, residuals, item content, and the purpose of scoring.
10. Building a Verifiable Calculation Workbook
A good workbook lets others trace standardized loadings to CR, AVE, and MSV without guessing the formulas. Each row represents an indicator, with columns for lambda, lambda squared, theta, and item notes. Its final section summarizes each construct and links to the latent-correlation matrix.
Do not retype rounded numbers from a PDF when the AMOS file is available. Export enough digits, lock formula cells, record the model version, and save the workbook with the output. Brown (2015) emphasizes interpreting CFA using the full solution and specification, rather than a single index table.
Step 1
Create a Parameters sheet and enter construct names, item names, lambda, and theta from the same CFA solution.
Step 2
For a simple standardized solution, calculate lambda squared and check that theta approximately equals 1 minus lambda squared.
Step 3
Calculate the sum of lambda separately and square that sum for the CR numerator.
Step 4
Calculate the sum of lambda squared for the AVE numerator; do not confuse it with the squared sum of lambda.
Step 5
Create a Latent correlations sheet and enter a symmetric factor-correlation matrix.
Step 6
Square each off-diagonal correlation and take the maximum for each construct to obtain MSV.
Step 7
Set warnings for out-of-range loadings, invalid AVE or CR, and absolute correlations exceeding 1.
Step 8
Record the run date, AMOS filename, removed items, and reasons so results remain traceable.
- Formulas contain cell references rather than hard-coded numbers.
- Loadings and correlations come from the same model version.
- Intermediate values retain sufficient digits.
- Each item change produces a new workbook version.
- Final results are checked through an independent calculation or second software package.
11. Common Calculation and Interpretation Errors
| Weak practice | Why it is incorrect | Remedy |
|---|---|---|
| Using unstandardized loadings in the simplified formula | Lambda and theta are on the wrong scales | Use a consistently standardized solution or estimate reliability from the model |
| Using different item lists for CR and AVE | The indices no longer describe the same construct | Freeze the final model’s indicator list |
| Squaring covariances to calculate MSV | Covariance depends on measurement units | Use latent correlations |
| AVE > MSV, therefore validity is perfect | One criterion does not cover all validity evidence | Add CIs or model comparisons and theory |
| Removing items to increase CR | May narrow the conceptual domain | Assess content and validate in another sample |
| Reporting only pass or fail | Calculations cannot be checked | Report loadings, CR, AVE, MSV, and the correlation matrix |
12. APA 7 Reporting Template and Completion Checklist
The following template uses hypothetical values. Replace all bracketed values with results from the final CFA model and identify the formula or software used for calculation.
Example report
The measurement model was estimated using IBM SPSS Amos [version]. Construct composite reliability ranged from CR = [min] to [max], while AVE ranged from [min] to [max]. For Trust, CR = .795 and AVE = .564. Its highest latent correlation was r = .620, corresponding to MSV = .384; AVE therefore exceeded MSV. The correlation matrix and square roots of AVE are presented in Table [ ]. Discriminant validity was also assessed using [correlation confidence intervals/model comparisons], indicating [qualified conclusion].
- Check the CFA solution before calculating indices.
- Use loadings and correlations from the same model.
- Distinguish the squared sum of loadings from the sum of squared loadings.
- Retain sufficient digits in intermediate calculations.
- Use latent correlations to calculate MSV.
- Check every construct pair rather than one favorable pair.
- Add discriminant-validity evidence when correlations are high.
- Justify every removed indicator using content and theory.
- Save the workbook for verification.
- Cross-check in-text citations against the reference list.
Conclusion
CR, AVE, and MSV summarize three different aspects of a measurement model, but are trustworthy only when derived from a valid CFA solution and a traceable calculation workflow.
A good report goes beyond stating that criteria were met. Readers need factor loadings, calculations, the correlation matrix, supplementary criteria, and theoretical reasons for every indicator-retention or removal decision.
References
- Fornell, C., & Larcker, D. F. (1981). Evaluating structural equation models with unobservable variables and measurement error. Journal of Marketing Research, 18(1), 39-50.https://doi.org/10.2307/3151312
- Raykov, T. (1997). Estimation of composite reliability for congeneric measures. Applied Psychological Measurement, 21(2), 173-184.https://doi.org/10.1177/01466216970212006
- Rönkkö, M., & Cho, E. (2022). An updated guideline for assessing discriminant validity. Organizational Research Methods, 25(1), 6-47.https://doi.org/10.1177/1094428120968614
- Brown, T. A. (2015). Confirmatory factor analysis for applied research (2nd ed.). Guilford Press.https://www.guilford.com/books/Confirmatory-Factor-Analysis-for-Applied-Research/Timothy-Brown/9781462515363
- Kline, R. B. (2023). Principles and practice of structural equation modeling (5th ed.). Guilford Press.https://www.guilford.com/books/Principles-and-Practice-of-Structural-Equation-Modeling/Rex-Kline/9781462551910
- McDonald, R. P. (1999). Test theory: A unified treatment. Lawrence Erlbaum Associates.https://www.routledge.com/Test-Theory-A-Unified-Treatment/McDonald/p/book/9781138012547
- IBM Corp. (2022). IBM SPSS Amos 29 user's guide.https://www.ibm.com/docs/en/SSLVMB_29.0.0/pdf/IBM_SPSS_Amos_User_Guide.pdf
Academic note: The example values illustrate formulas and interpretation. Thresholds are practical guidelines; research conclusions must consider model specification, uncertainty, scale content, and supplementary evidence.