
Metric, Ordinal, Binary, and Categorical Data in SmartPLS 4
Data types in SmartPLS are more than decorative labels. They determine how the software interprets distances, order, and groups in each data column.
Metric data convey quantitative information, ordinal data retain order, binary data have two states, and categorical data represent unordered groups. Identical numerical codes do not make these data types equivalent.
Data type and coding require explicit decisions
- Continuous
Numeric distances are meaningful
- Ordinal
Ordered categories; consider spacing
- Binary
Two groups with explicit reference coding
- Nominal
Unordered categories
Conceptual diagram. Declare measurement levels and coding before choosing an estimator.
Source: Lê Minh · Conceptual illustration, not software output.1. Distinguishing Four Data Types
A column containing numbers is not automatically metric. Codes 1, 2, and 3 for three occupations remain categorical because the difference between 1 and 2 has no quantitative meaning.
| Type | Characteristic | Example |
|---|---|---|
| Metric | Distances between values are meaningful | Age, revenue, total scores |
| Ordinal | Ordered, but intervals are not necessarily equal | Educational level, rankings |
| Binary | Only two states | Yes/no, intervention/control group |
| Categorical | Unordered groups | Province, occupation, enterprise type |
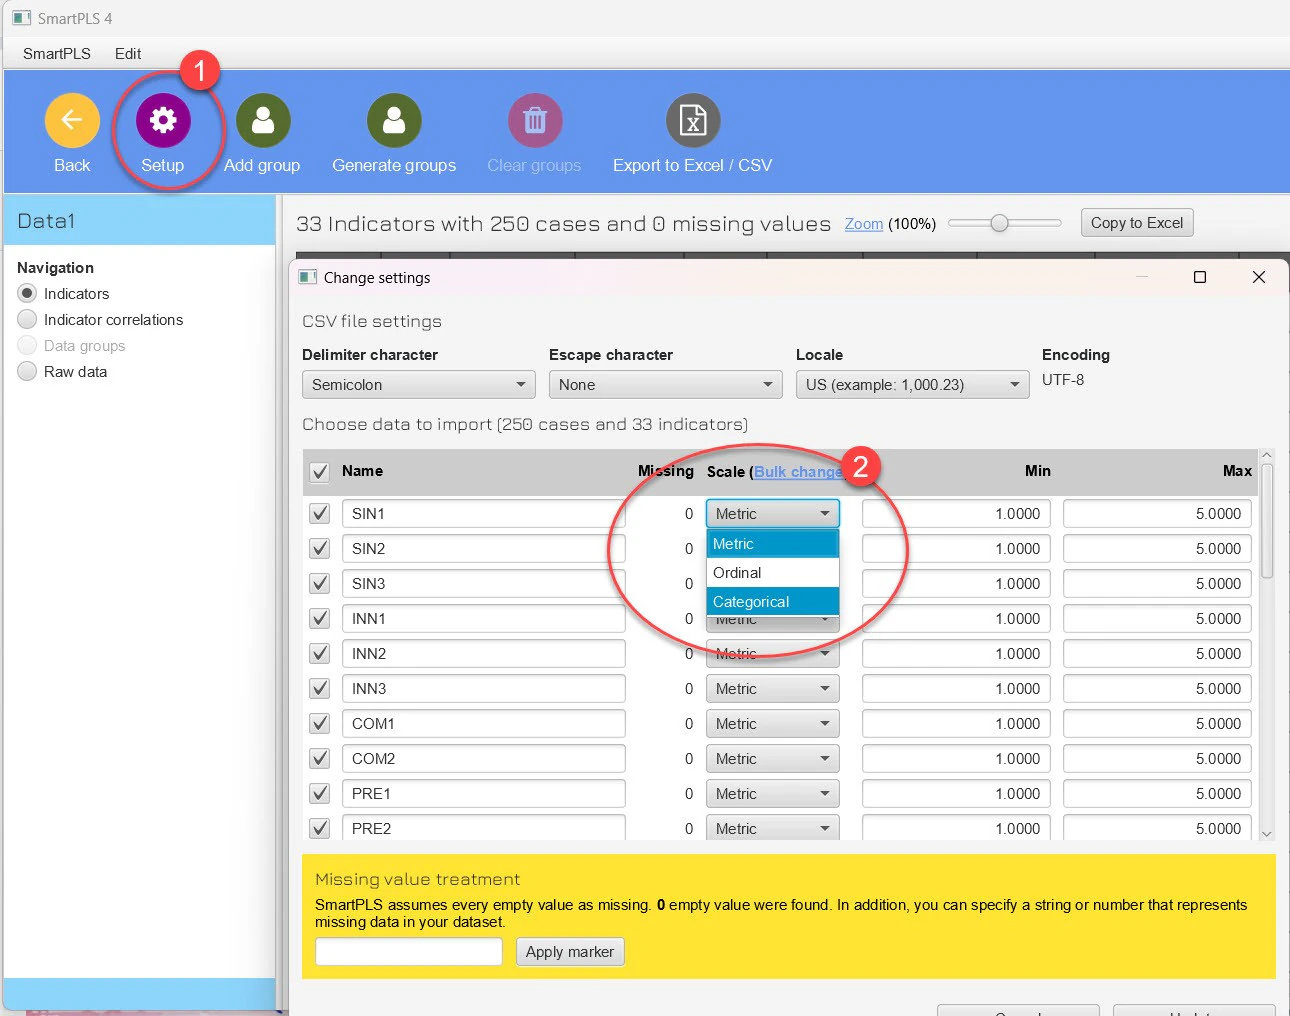
2. How Should Likert Scales Be Defined?
Individual Likert items are inherently ordinal. In many PLS-SEM applications, items with multiple response categories are treated as metric for linear-model estimation. This decision should suit the scale design, number of response categories, and methodological conventions of the study (Ringle et al., 2024).
Do not change the data-type setting merely because one option produces more attractive results. Document the decision in advance and examine the actual data.
Codes such as 99 or -999 must be defined as missing or converted to blank cells according to the data workflow. Treating them as genuine values can distort means, variances, and model coefficients.
3. Coding Binary and Categorical Variables
Use 0/1 for binary variables in regression or moderation so coefficients have a clear reference point. For categorical variables with more than two groups, do not enter codes 1, 2, and 3 directly as a metric variable. Create appropriate dummy variables or use grouping functions if the objective is MGA.
| Variable | Recommended coding | Note |
|---|---|---|
| Intervention | 0 = control; 1 = intervention | Group 0 is the reference |
| Region with 3 groups | Two dummy variables | Retain one reference group |
| Satisfaction level 1-5 | Ordinal, or metric with justification | Do not change labels between data-collection waves |
| No response | Missing | Do not use 0 if 0 is a valid value |
4. Pre-Import Checking Workflow
Create a codebook
Record variable names, labels, data types, value codes, and missing-value rules.
Check out-of-range values
Find unfamiliar codes, spaces, inconsistent decimal separators, and text cells in numeric columns.
Check item direction
Correctly reverse-code negatively worded items before calculating scores or estimating the model.
Cross-check groups
Ensure that group codes in the data match the definitions used in SmartPLS.
Save a frozen dataset
Retain a dated copy of the clean data and do not edit it directly after analysis begins.
5. Common Errors
| Error | Consequence |
|---|---|
| Treating every numeric column as metric | Creates artificial distances between groups |
| Using 1/2 for a binary moderator | Makes the reference point difficult to interpret |
| Retaining missing-value codes such as 99 | Distorts descriptive statistics and estimates |
| Changing codes across files | Incorrect groups or reversed effect direction |
6. Data Checklist
- Each variable has a unique, short name without unusual spaces.
- The codebook exactly matches the file imported into SmartPLS.
- Missing-value codes have been handled and frequencies checked.
- Binary variables use 0/1 when a regression reference point is needed.
- Multicategory variables have not been entered as metric variables.
- The decision on treating Likert items is documented in the research methods.
Conclusion
A clean dataset requires more than an absence of blank cells. Every column must represent the correct measurement meaning and use consistent coding. Checking data types before building the model prevents errors that are difficult to detect during interpretation.
References
- Ringle, C. M., Wende, S., & Becker, J.-M. (2024). SmartPLS 4.https://www.smartpls.com
- SmartPLS. (n.d.). PLS-SEM glossary.https://www.smartpls.com/documentation/literature/glossary/
Academic note: Determine data types from the nature of the variables and the measurement design, rather than whether a column displays numbers or text.