

T-TEST AND ONE-WAY ANOVA ANALYSIS GUIDE
(PART 2 – ADVANCED)
This content is copyrighted by Amosleminh.com. If you copy it, please cite the source. Thank you very much.
In this section, many people will wonder what is so advanced about T-test and One-way Anova? In fact, because we often encounter this type of testing for low-order models, we will generally find it simple (because it is so familiar). However, when it comes to the higher-order model, we are sure that most of you will be confused, because its techniques are relatively complicated and less common. In this advanced part, we will guide you through T-test and Anova analysis for the 2nd-order model, specifically comparing demographic variables with the 2nd-order variable in the 2nd-order model.
The analytical model has the following form:
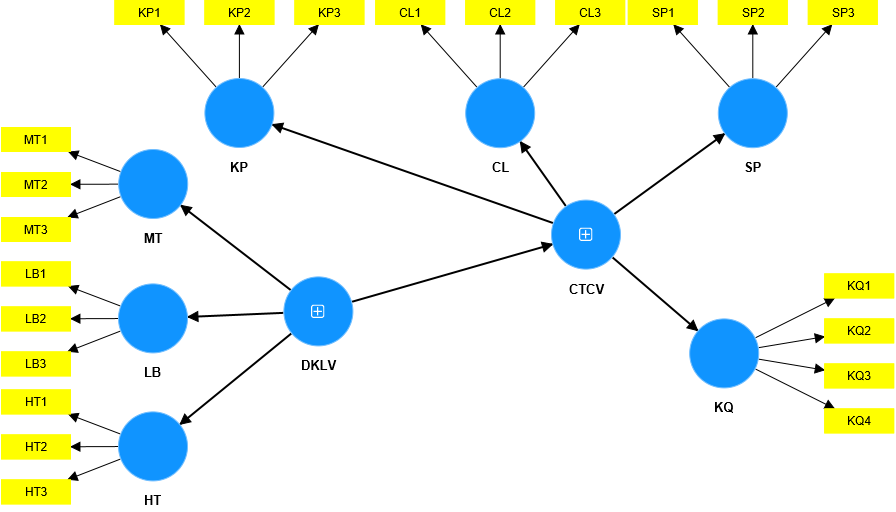
Hypotheses:
- H1: Working conditions (DKLV) positively influence Job Stress (CTCV).
- H2: Job stress (CTCV) positively affects job performance (KQ)
- H3: Gender has a statistically significant difference with job stress.
- H4: Education level has a statistically significant difference with job stress.
- H5: Working time has a statistically significant difference with job stress.
We can see, demographic variables including Gender, Education Level and Working Time need to be analyzed by T-test and One-way Anova in this case. A big problem that appears here is that the mean comparison variable in this case is a 2nd order variable (a type of variable that is not directly measured, so we do not take the mean value to represent it in the usual way we do). for level 1 variables).
Here, we will consider and evaluate the implementation in both cases: first is the PLS SEM model running on SmartPLS 4, second is the CB SEM model running on AMOS.
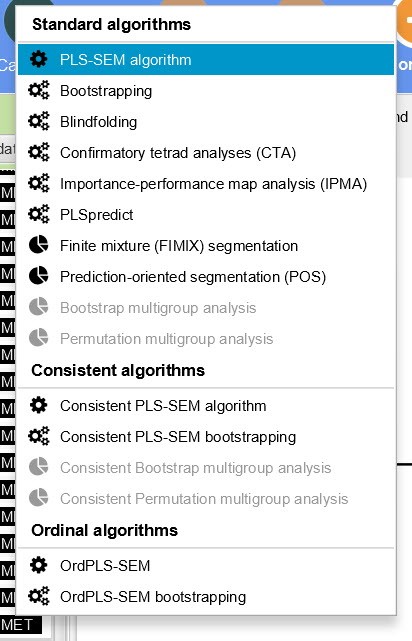
I. PLS SEM MODEL
For the PLS SEM model running on SmartPLS 4 platform, we can completely perform T-test or One-way Anova analyzes for 2nd order variables. By using the 2-stage analysis method, we We will convert the second-order model to a first-order model. Please refer to the details on how to use the 2-stage analysis method .
The second-order model is converted to a first-order model according to the specific 2-stage method as follows:
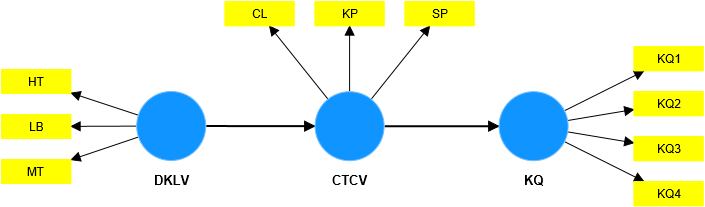
Now to get the value of CTCV variable to perform T-test or One-way Anova, we will run path model analysis and extract latent data of CTCV variable to transfer to SPSS data. Note that, in the stage 1 model, when running path analysis, we still see the appearance of CTCV latent variables, but we do not get CTCV results in this stage 1, we need to convert the higher-order model. to the first-order form, then analyze and get data for the latent variable CTCV.
Step 1:
Step 2:
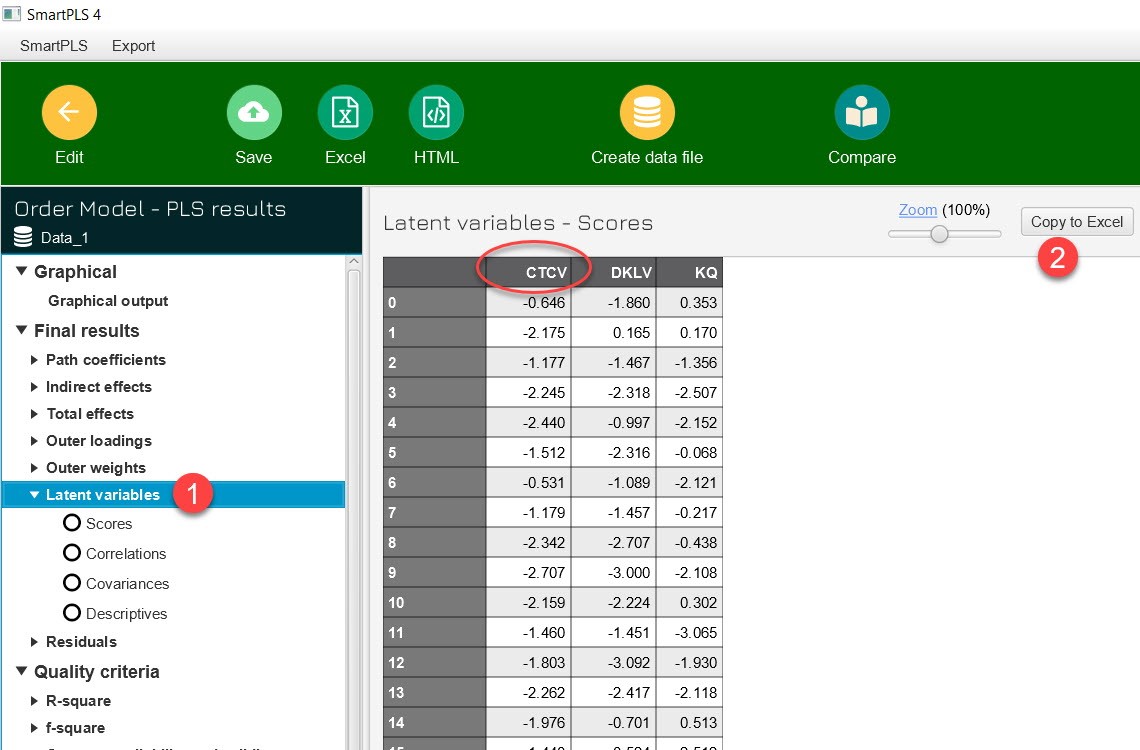
Step 3: Transfer CTCV data to SPSS data file
Step 4: Perform T-test and Anova analysis
We have the following demographic variables:
| Variable name | Encode | Characteristic |
| Gender | 1 | Male |
| 2 | Female | |
| Working time | 1 | ≤ 5 year |
| 2 | 5 to 10 years | |
| 3 | 11 to 20 years | |
| 4 | Over 20 years | |
| Academic level | 1 | ≤ High School |
| 2 | Intermediate college | |
| 3 | University | |
| 4 | After university |
Next, we will analyze Anova one way for the working time variable. The analysis results are as follows:
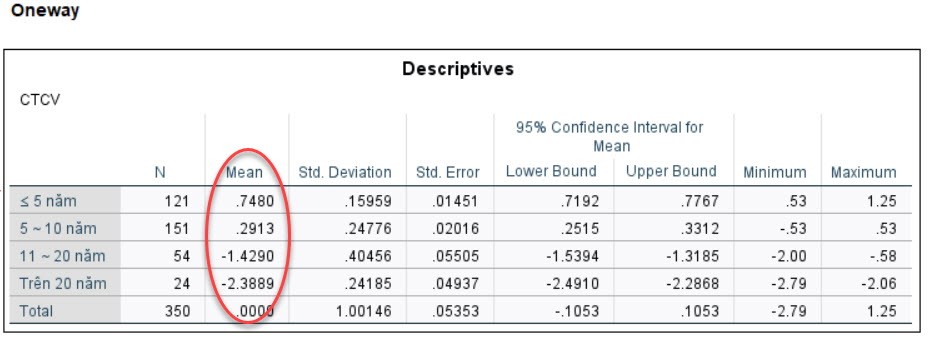
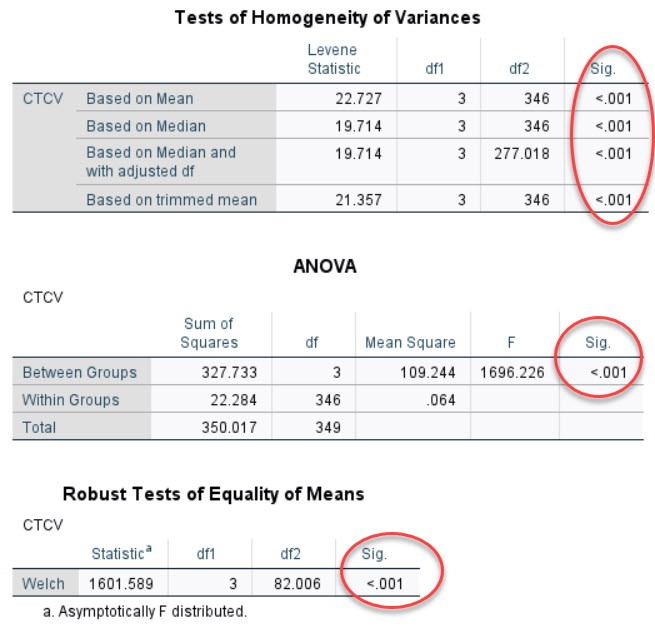
It can be seen that working time has a statistically significant difference with job stress. Similar to part 1, we also plot the mean CTCV for each working time group to see what the influence trend is.
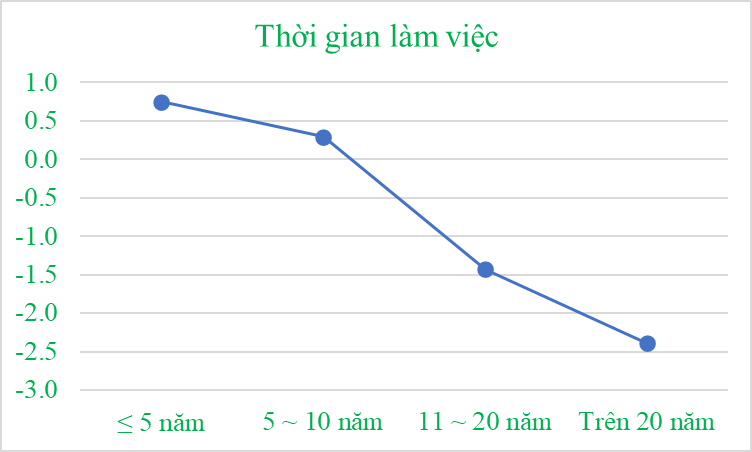
From the graph it can be seen that the less time an employee works, the higher the level of stress at work.
We can also standardize the CTCV variable before putting it into T-test or Anova analysis, which is also ok. Basically, the trend of working time with CTCV remains unchanged.
II. CB SEM model
In CB SEM running with AMOS, for high-order models, getting the latent variable value of the higher-order variable is very complicated and difficult. Therefore, in this case we cannot perform T-test or Anova analysis. The almost only solution in this case is that we must switch to MGA analysis. For details on how to analyze MGA, please see here. In the scope of this article, we only present the MGA results.
The invariant model has the following results:
The variable model has the following results:
The results of model selection testing are as follows:
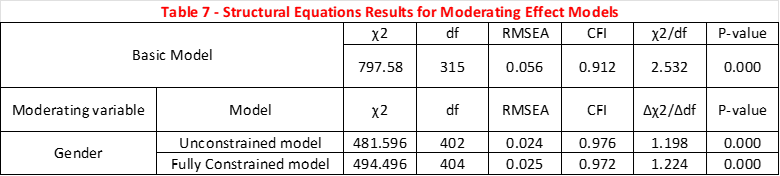
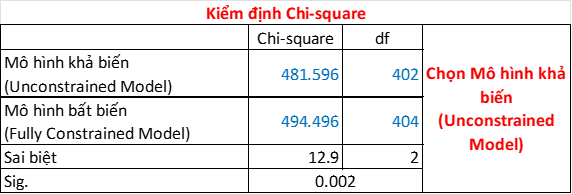
The results show that the Chi-square test selected the variable model. This means, Gender has a statistically significant difference in the research model. This deductive result has a broader meaning than the T-test or Anova test. In other words, different gender groups will have different job stress. Now we will try to draw a CTCV chart according to each gender group to evaluate the trend of their influence?
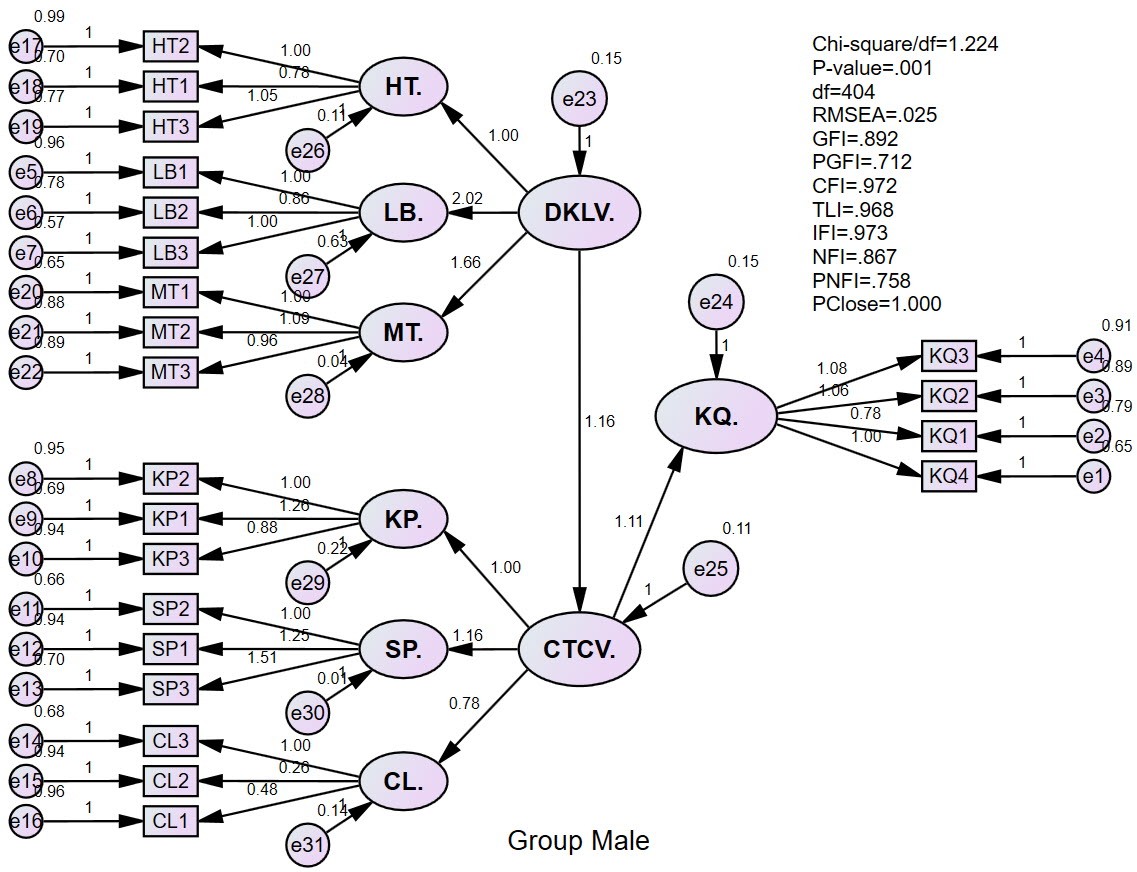
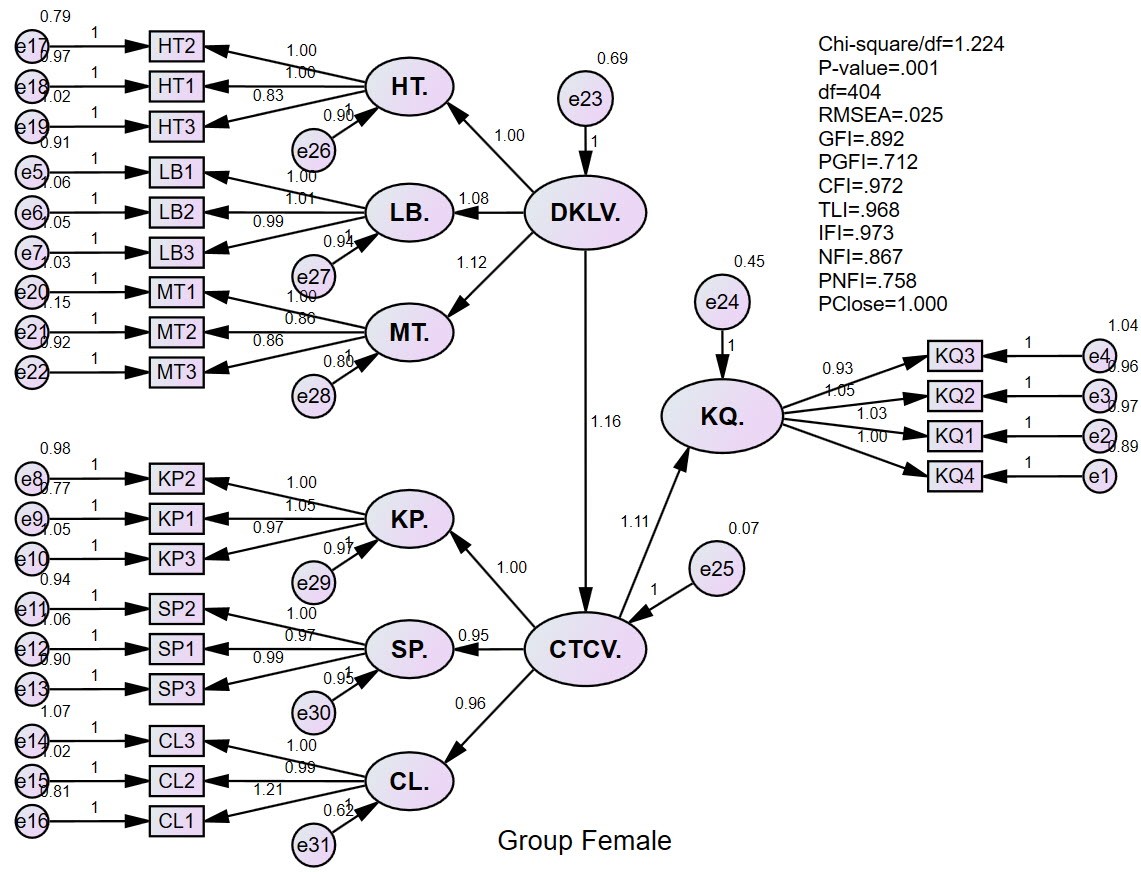
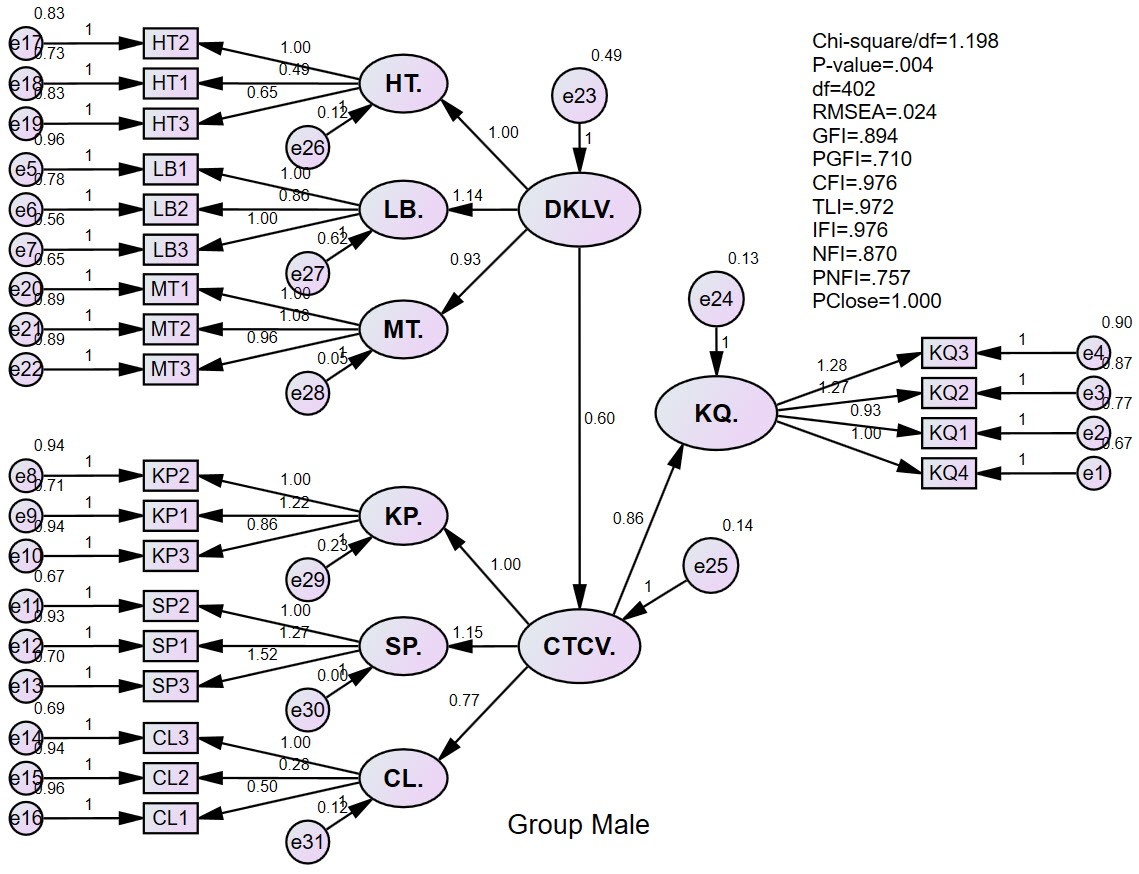
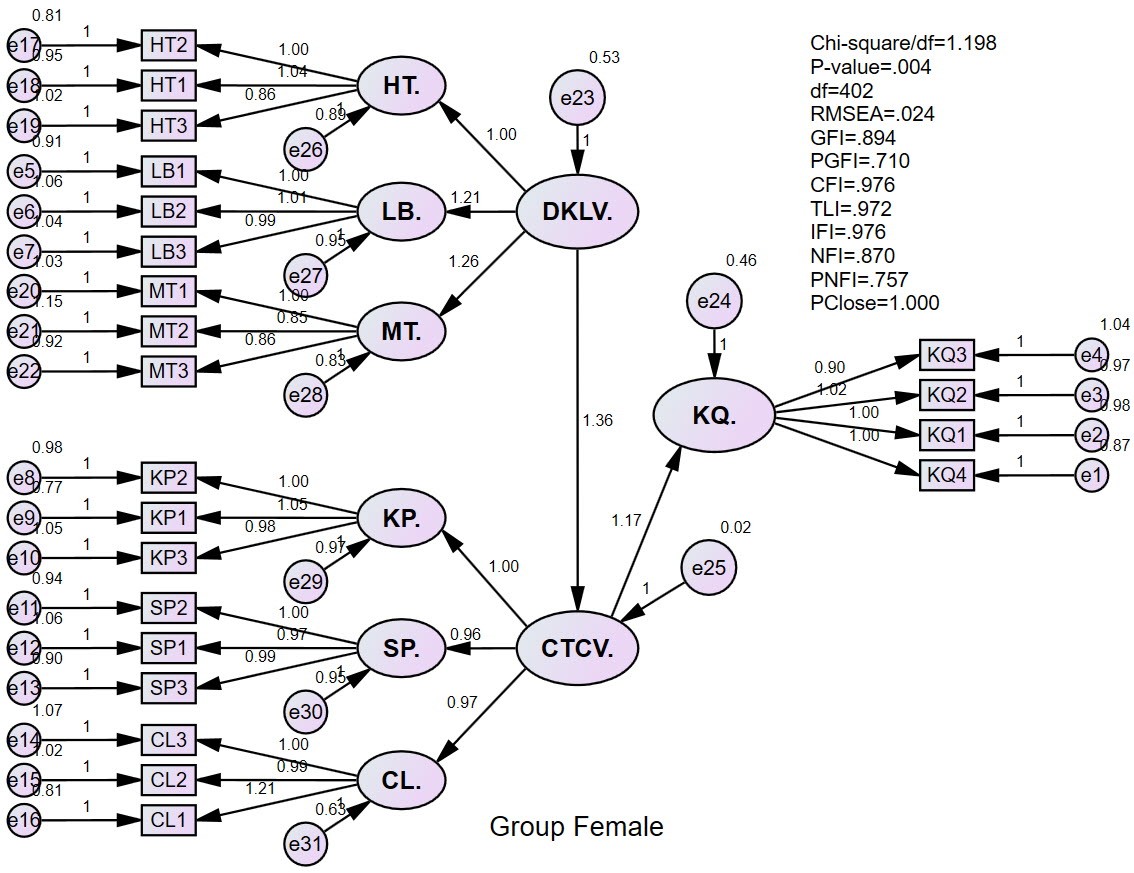
The results of SEM analysis by each gender group for the variable model are as follows:
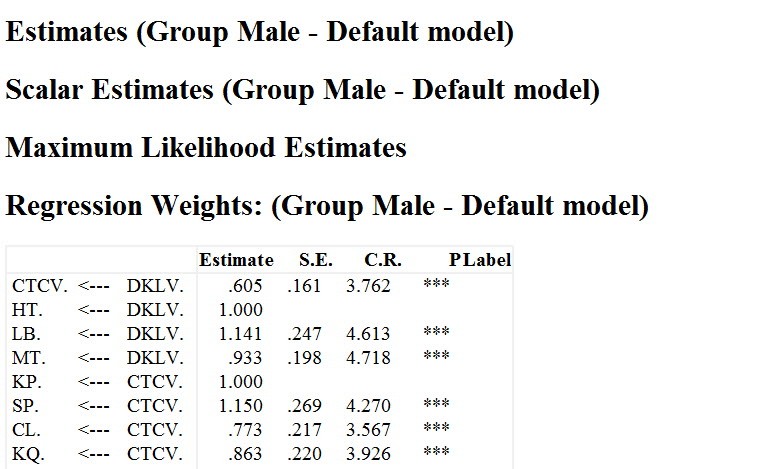
For the male gender group
For the Female gender group
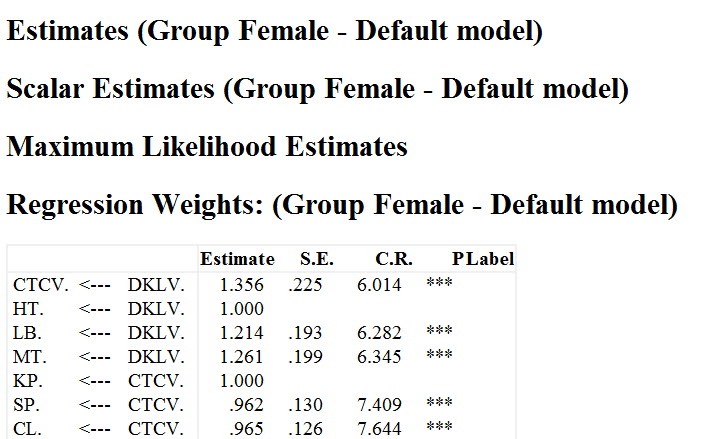
Work stress is reflected by three factors: KP, SP, and CL. So the CTCV graph by gender group is shown as shown below. We cannot directly evaluate the CTCV variable, because we cannot calculate the potential value for the CTCV variable. Therefore, here, we only consider and evaluate the factors that reflect on CTCV.
The results can be seen that the KP factor is not influenced by different gender groups. Meanwhile, the male gender group makes SP factors tend to have a higher influence on CTCV than the female gender group. The CL factor is the opposite of SP. In this case, in our opinion, the research needs to conduct more qualitative assessments from experts to consider which of the two factors Product and Quality is more important. From there, the research has a basis for making recommendations for businesses.
Note that the above arguments are to resolve the T-test and Anova story, but the MGA assessment will be different. MGA is more specialized, it compares the effects between gender groups on the overall model, so the direction of MGA analysis will be different.
At this point, we would like to temporarily end the in-depth analysis of the T-test and One-way Anova tests. In the near future, we will update more in-depth application knowledge about variance analysis using SPSS and specialized software.