

INSTRUCTIONS FOR IMPORTANCE-PERFORMANCE MAP ANALYSIS (IPMA) USING SMARTPLS
Introducing IPMA
Importance-Performance Map Analysis (IPMA) is a great tool integrated by SmartPLS. In AMOS users will not see this tool because AMOS does not integrate it. IPMA helps evaluate the importance and performance of factors in the model. By assessing the correlation between the importance and performance of factors, IPMA helps identify important factors that need to be improved and prioritized in your research. IPMA provides visual graphs, in which the vertical axis represents the performance of constructs or observed variables (indicators), and the horizontal axis represents their importance. Consider based on the total influence (beta coefficient) analyzed from the SEM model. Using this graph, the analyst can easily evaluate the importance of each factor in the model. From there, help Enterprises come up with reasonable strategies, saving time and costs.
Instructions for IPMA analysis in SmartPLS 4
Notes before analyzing IMPA (according to Hair et al. (2017) Vietnamese version translated by Nguyen Quang Anh):
- The scale used in the model must be either a quantitative scale (Metric scale) or an interval scale (Ordinal scale); Observed variables measured on a nominal scale will not be used for IPMA analysis.
- All observed variables must have the same measurement tendency. That means to negate, we must negate everything, and to affirm, we must affirm everything. Otherwise, we would not be able to conclude that higher latent variable scores result in better performance. So in case the model has structural variables measured using an inverse scale, we should convert it back to a positive scale before running IMPA.
- Regardless of whether the model measures cause or effect, the external weight estimates must be positive.
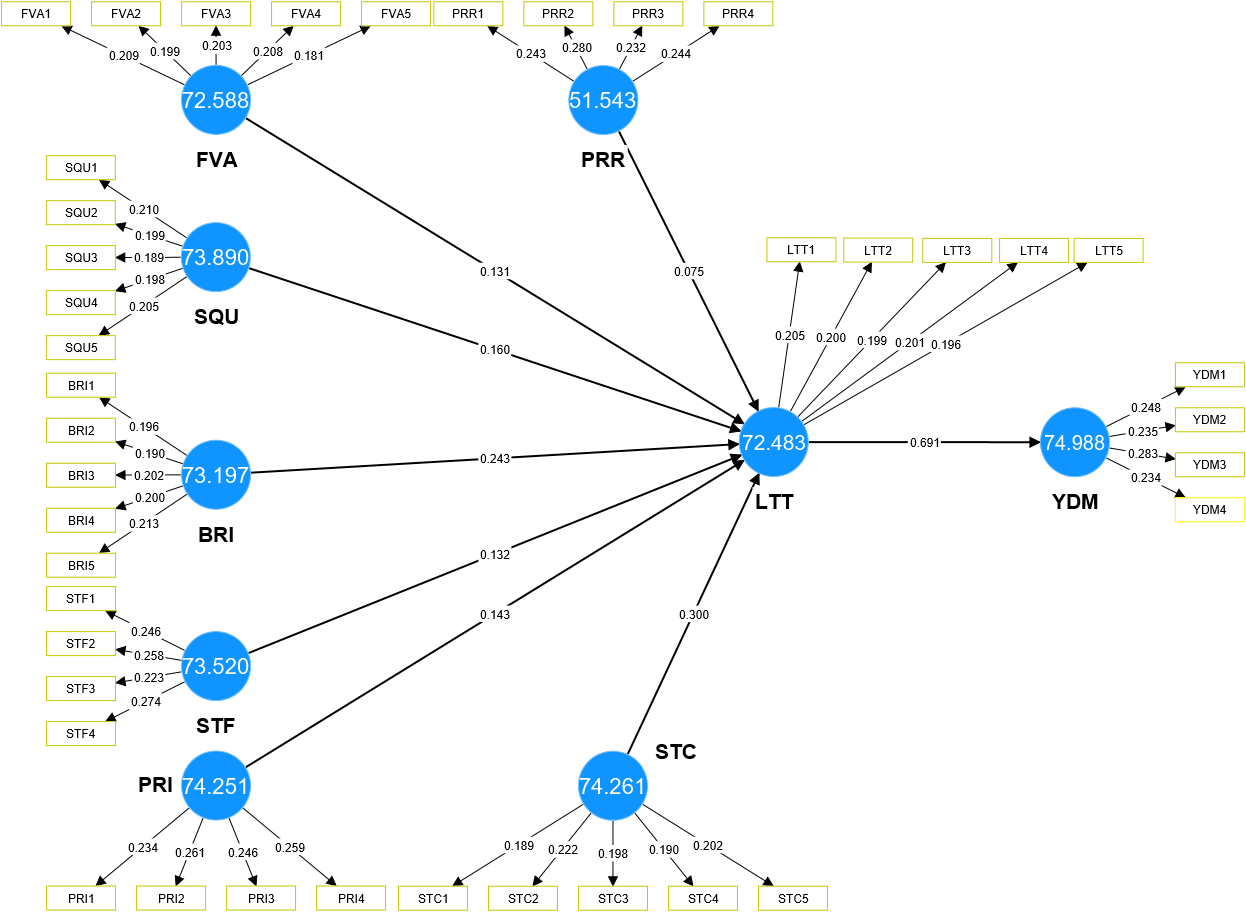
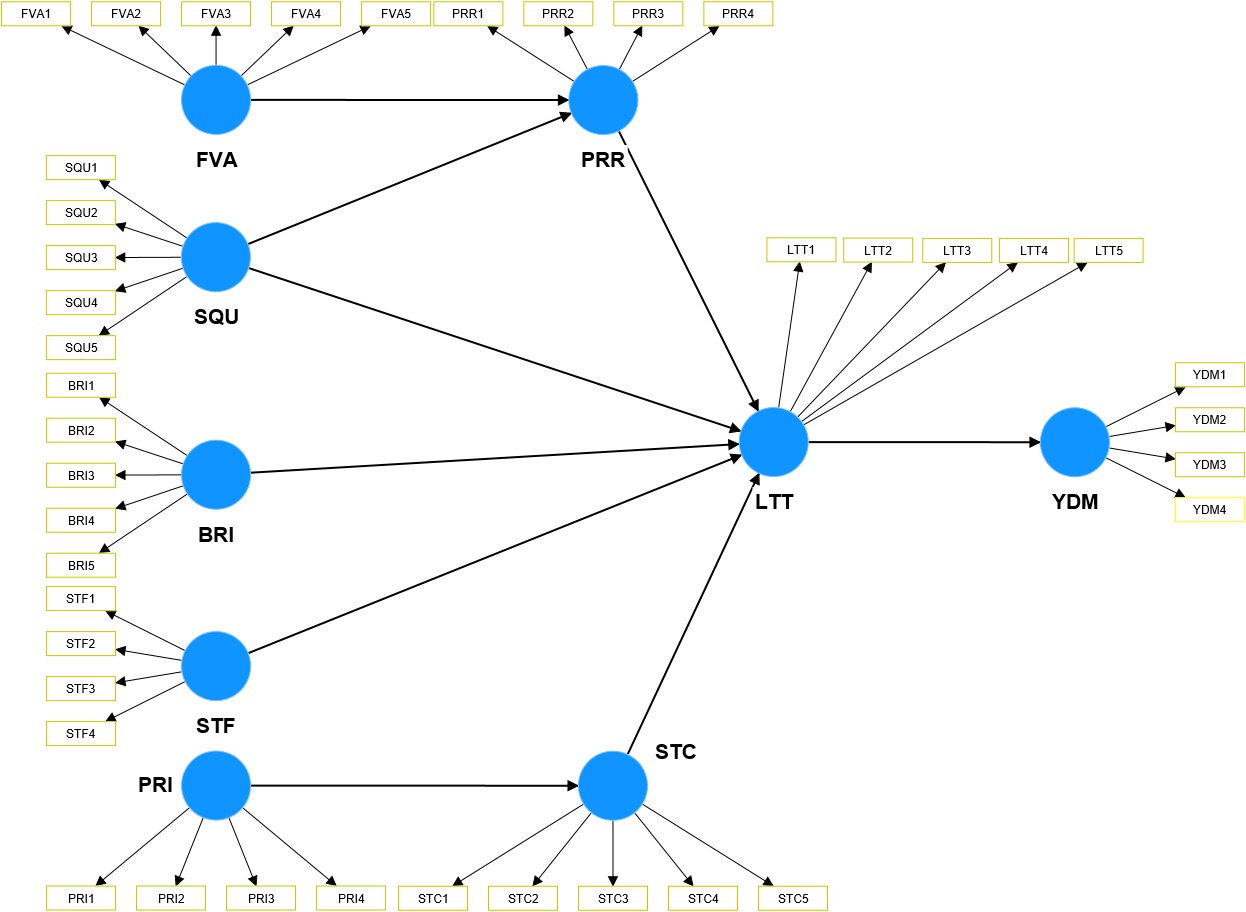
To understand better, we will conduct a specific analysis with a model as follows:
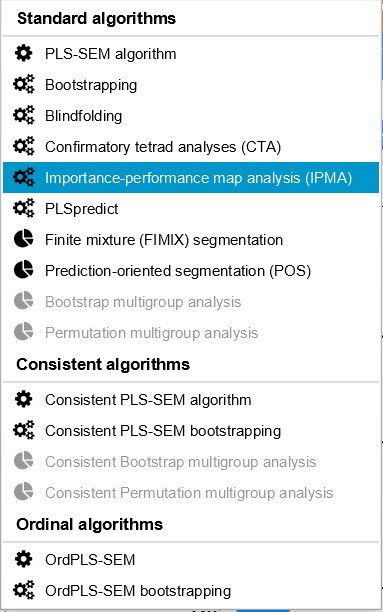
We choose IPMA analysis
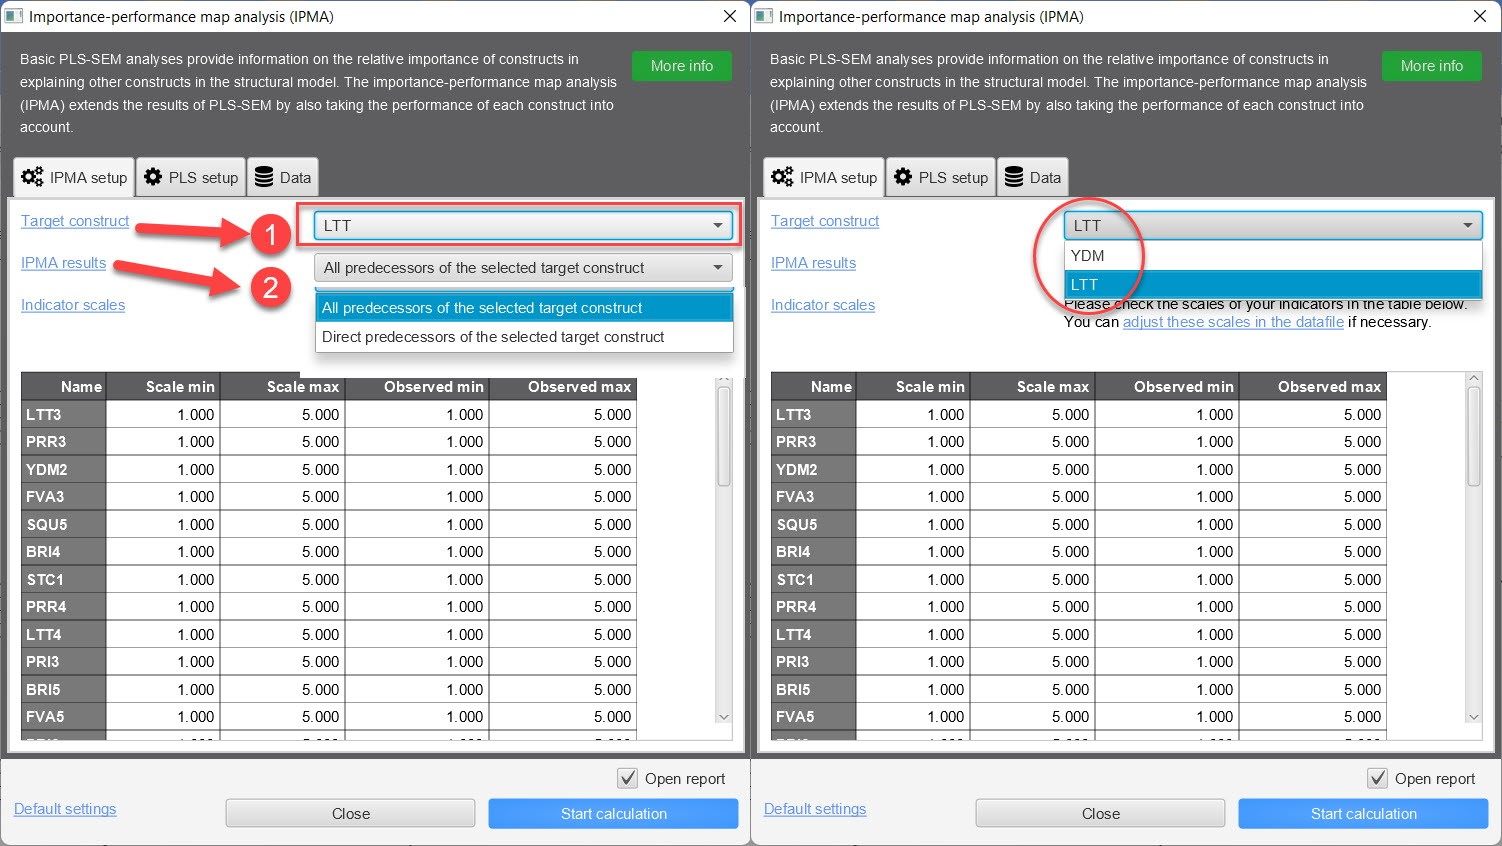
Number 1 is to choose the target variable that you need to analyze the influence of other variables in the model on it. Our model has 2 endogenous variables (1 intermediate variable LTT and 1 dependent variable YDM), so here we will see that there are 2 program variables given for us to choose the target variable for analysis. With this model, in my opinion, we should choose LTT as the target variable. Because YDM is only directly affected by LTT, improving LTT will certainly improve YDM.
Number 2 is to select the analysis results extracted from IPMA. If you select All, all variables that affect LTT (including direct effects and indirect effects) will be displayed and IP (Importance-Perfomance) for LTT will be considered. In case you select Direct, only variables that point directly to LTT will be analyzed for IP with LTT. In the current model, we choose All.
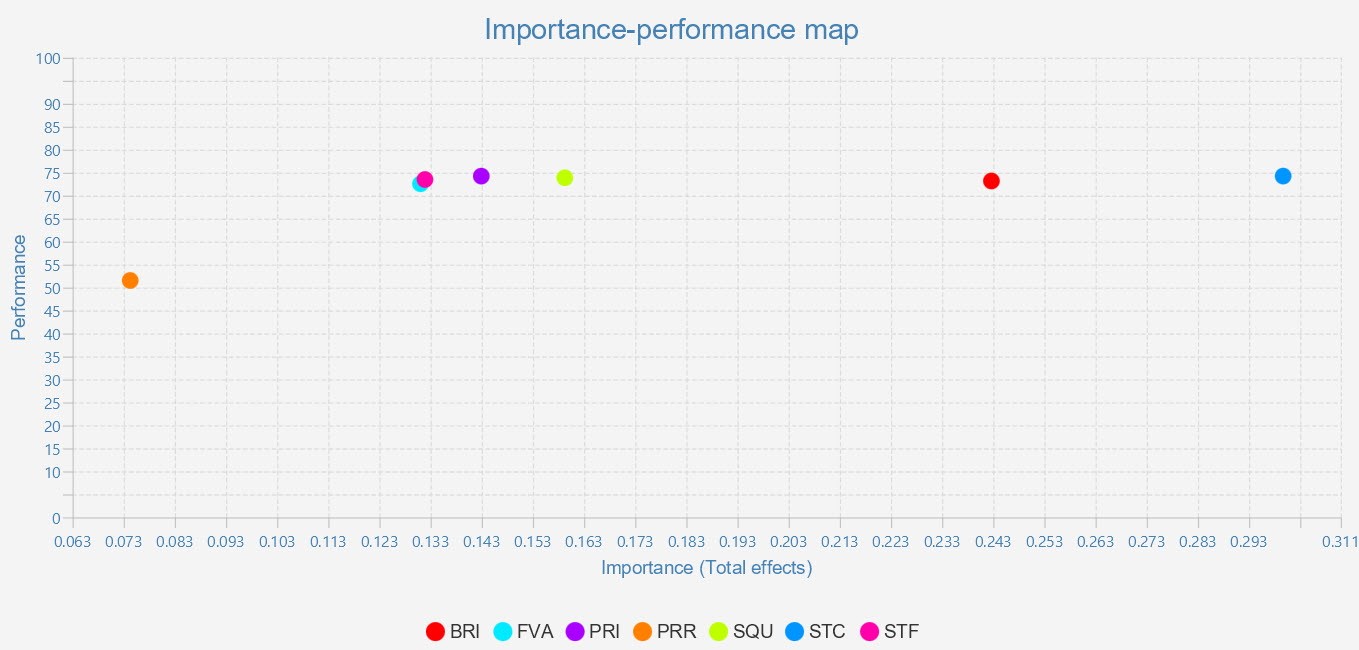
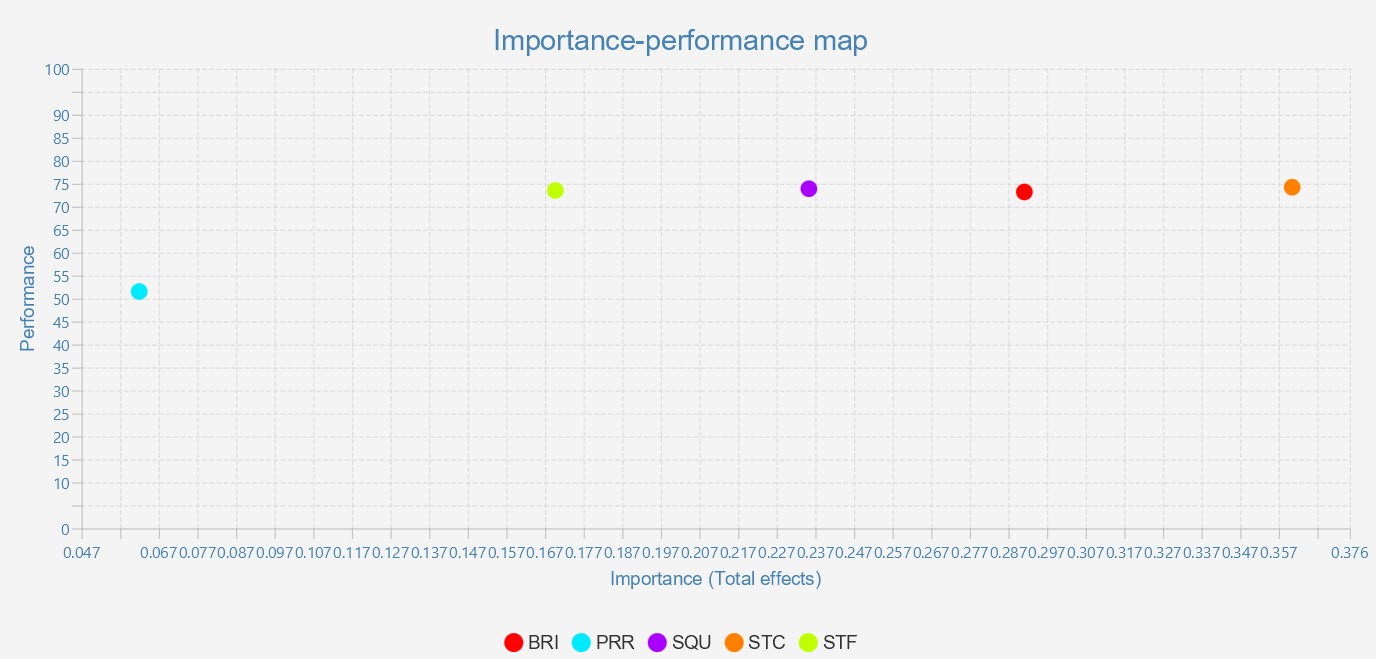
From the graph it can be seen that BRI and STC are two factors with high efficiency + high importance, so when choosing solutions we should focus on these two factors which will bring high efficiency. best. PRI has higher performance than SQU, but SQU has a much higher level of importance than PRI, so to choose one of the two, in my opinion, we should choose SQU.
Now, I will calibrate the model so that when analyzing IPMA, we choose Direct as number 2 to see the difference more specifically.
As a result of IPMA analysis, we will see that there are only 5 factors left that are IP analyzed for LTT.
Expanding IPMA at the level of observed variables:
One of the strengths of IPMA in SmartPLS is the ability to analyze IP graphs at the observed variable level. After we run the IPMA analysis procedure, the results will appear on the screen.
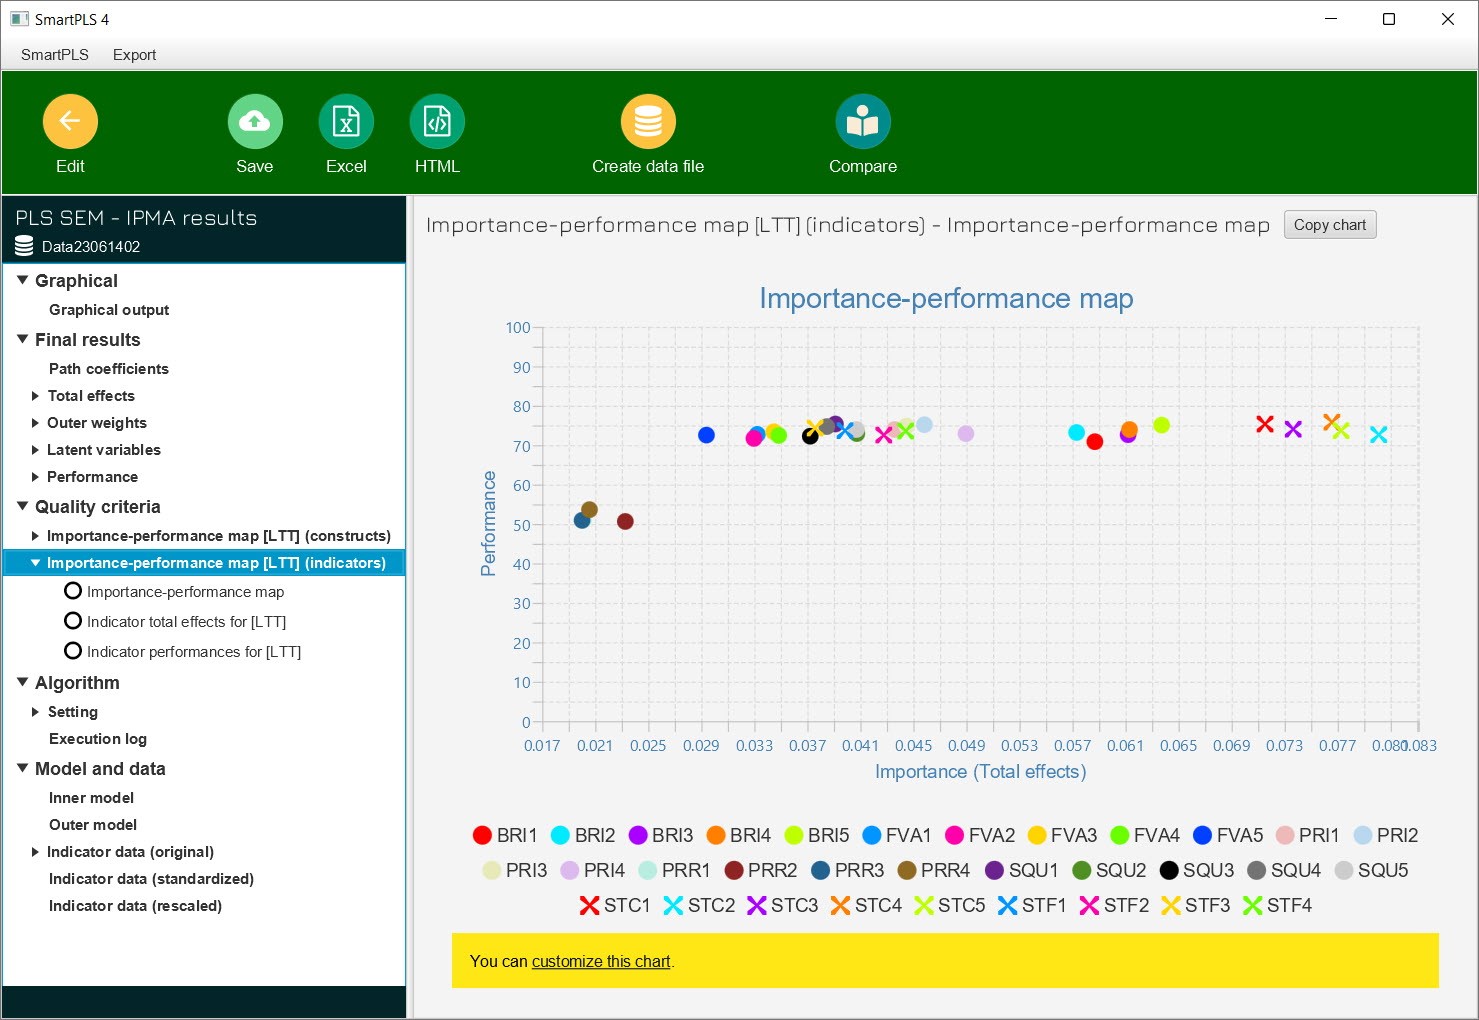
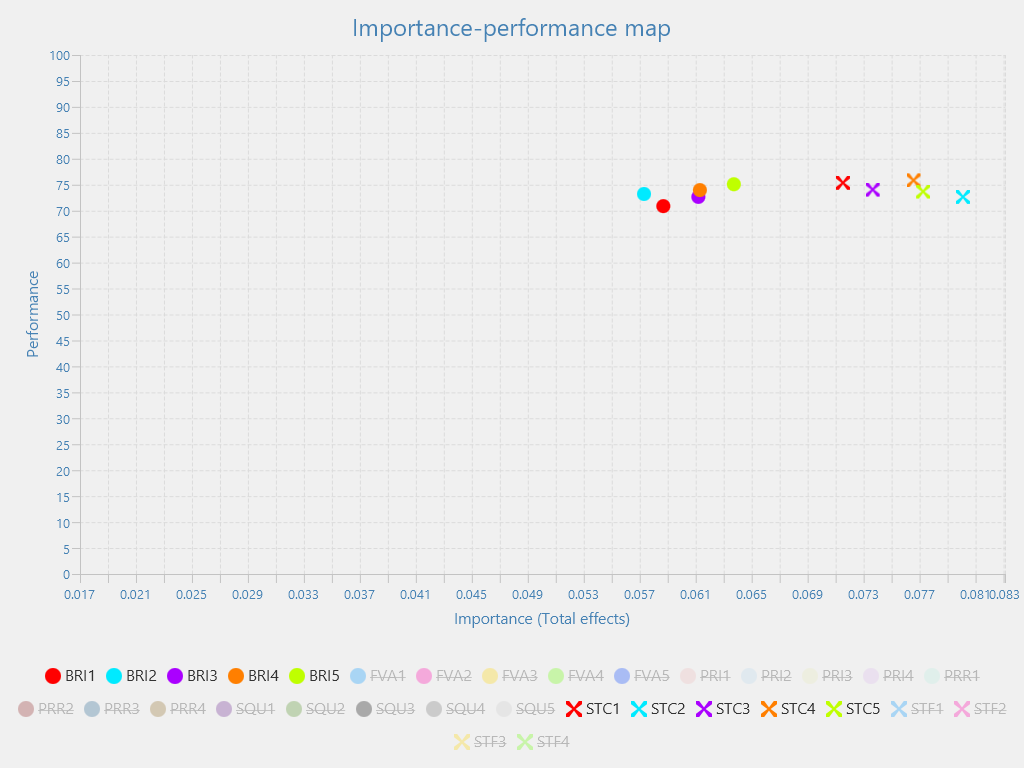
We select the analysis section for indicators. On the right side of the screen, a graph of the importance and performance of the indicators on the analysis construct variable will appear. The method of evaluation and analysis is similar to the graph of constructs. Evaluating all observed variables is relatively complicated for models with many observed variables (typically the example illustrated here). Therefore, when we analyze, we should choose observations belonging to the prioritized constructs as mentioned in the beginning for evaluation. Specifically, in the illustrative example, we will choose STC and BRI as the two constructs that receive the most attention in this research situation.
Thus, it can be seen that IPMA has the following advantages:
- Better understanding of priorities and prioritization: IPMA helps you evaluate the importance and performance of factors in the model. By drawing an IPMA chart, you can clearly see which factors are important and achieve good performance, thereby guiding your decisions and focusing on the factors with the greatest impact.
- Improve strategy and management: IPMA provides important information to improve strategy and management. By identifying important but low-performing elements, you can focus on improving their performance. At the same time, IPMA also helps identify factors that are unimportant and not worth focusing on, helping to save resources and efforts.
- Competitive positioning: IPMA helps you position your model against your competitors. By comparing the positions of factors on the IPMA chart, you can determine the strengths and weaknesses of your model compared to your competitors. This helps you build a competitive advantage and develop the right strategy.
Enhance interaction and consensus: IPMA is a useful tool to increase interaction and consensus between groups within an organization or between stakeholders. By discussing and discussing the location of elements on the IPMA chart, stakeholders can be on the same page and create a common direction.
Hopefully, you have had an overview of IPMA. Note, currently only SmartPLS among SEM model analysis software supports IPMA. This is SmartPLS’s strong point. Since SmartPLS version 4, CB SEM has been integrated, however, I personally noticed that CB SEM using SmartPLS gives not really accurate results in many indicators (typically Cronbach’s alpha), I have run and compared with both PLS SEM using SmartPLS and using SPSS for comparison. This is not a topic about CB SEM vs PLS SEM, however I would like to share a little detail about the difference between AMOS and SmartPLS. Each program has its own beauty. I will talk in more detail about CB SEM when using these two programs in another topic.
♥ To better understand how to analyze IPMA in depth, we refer to the document of Hair et al. (2017). According to Hair et al (2017), the authors believe that when selecting factors to improve the model, factors with high importance and low performance should be prioritized. And the order of priority is still importance, which is the total influence of the factors in the model.
♥ This article is really not complete. You can refer to Le Minh Services’ in-depth SmartPLS courses for more detailed support. Sincerely thank you!
References:
Hair Jr, J. F., Sarstedt, M., Ringle, C. M., & Gudergan, S. P. (2017). Advanced issues in partial least squares structural equation modeling. saGe publications.