

INTRODUCING COMMON METHOD VARIANCE (CMV) – HOW TO IDENTIFY AND PREVENT
What is CMV?
Common method variance (CMV) is the variance attributable to the common method, a phenomenon where a common method factor influences evaluations in a study. It occurs when variables in the study are measured using the same method or through the same source of information. As a result, the distinction between variables becomes blurred and difficult to discern due to the influence of the common method factor.
In summary, CMV can lead to issues in research such as biasing results, reducing accuracy and interpretability, or creating spurious relationships between variables.
How to Avoid CMV?
According to Chang and colleagues (2010), there are four ways to minimize or avoid CMV in research data:
- Construct scales from multiple sources of information (diversify data sources used to construct scales). Chang and colleagues (2010) recommend that the scales of independent variables should use different sources of information than dependent variables. Questions should be simple, concise, easy to understand, avoiding technical terms that may confuse respondents and lead to inaccurate choices.
- Surveys should randomize the order of questions (this is good for eliminating CMV, but a drawback is that it may disrupt respondents’ thought flow within the same scale). Use different types of scales, employ control variables to check if respondents truly grasp information and answer questions accurately. Ensuring respondent information security helps respondents answer truthfully, thus reducing CMV.
- Employ a cross-sectional study design to help respondents better understand the current situation of products or services and provide more accurate answers.
- Apply analysis methods such as Harman’s one-factor test to check and adjust for CMV.
Combining all these measures is the best way to minimize or avoid CMV in research.
A cross-sectional study design (also known as a prevalence study or a frequency study) is a data collection method in scientific research where data is collected at a specific point in time from a group of people or objects under study. This design allows researchers to collect information about observed variables at a single point in time and analyze the relationships between them.
Identifying CMV
According to Tehseen and colleagues (2017), there are four methods to identify CMV. They are:
- Harman’s Single-Factor Test
- Partial Correlation Procedures
- Partialling Out of General Factor
- Partialling Out a Marker Variable (Lindell & Whitney, 2001)
- Partialling Out a “Marker” Variable (Podsakoff et al., 2003)
- Correlation Matrix Procedure
- The Measured Latent Marker Variable Approach
- Construct Level Correction (CLC) Approach
- Item level correction (ILC) Approach
Among them, method 4 is recommended for use after analyzing measurement and structural models to observe the impact of CMV on R2 values and path coefficients. It’s important to note that these methods are used to identify CMV in research data, not to eliminate or exclude CMV from research data.
Here, we present two methods for identifying CMV in research data. The first method involves conducting Harman’s one-factor test using SPSS, and the second method involves performing Partial Correlation Procedures using SmartPLS.
I. Guide to Conducting Harman’s One-Factor Test Using SPSS
This is one of the most common tests researchers conduct to check for CMV in their studies. Harman’s one-factor analysis is a post hoc procedure conducted after data collection to examine whether a single factor is responsible for differences in the data (Chang et al., 2010). In this method, all observed variables measuring scales in the research model are entered into a factor analysis to test whether a single factor emerges or whether a single common factor accounts for most of the covariance between measures; if no single factor emerges and accounts for most of the covariance, it means CMV is not a common issue in the study (Chang et al., 2010). Use factor analysis in SPSS to conduct this test. The following steps are performed when conducting this test:
(1) Input all items into the factor analysis and run principal component analysis.
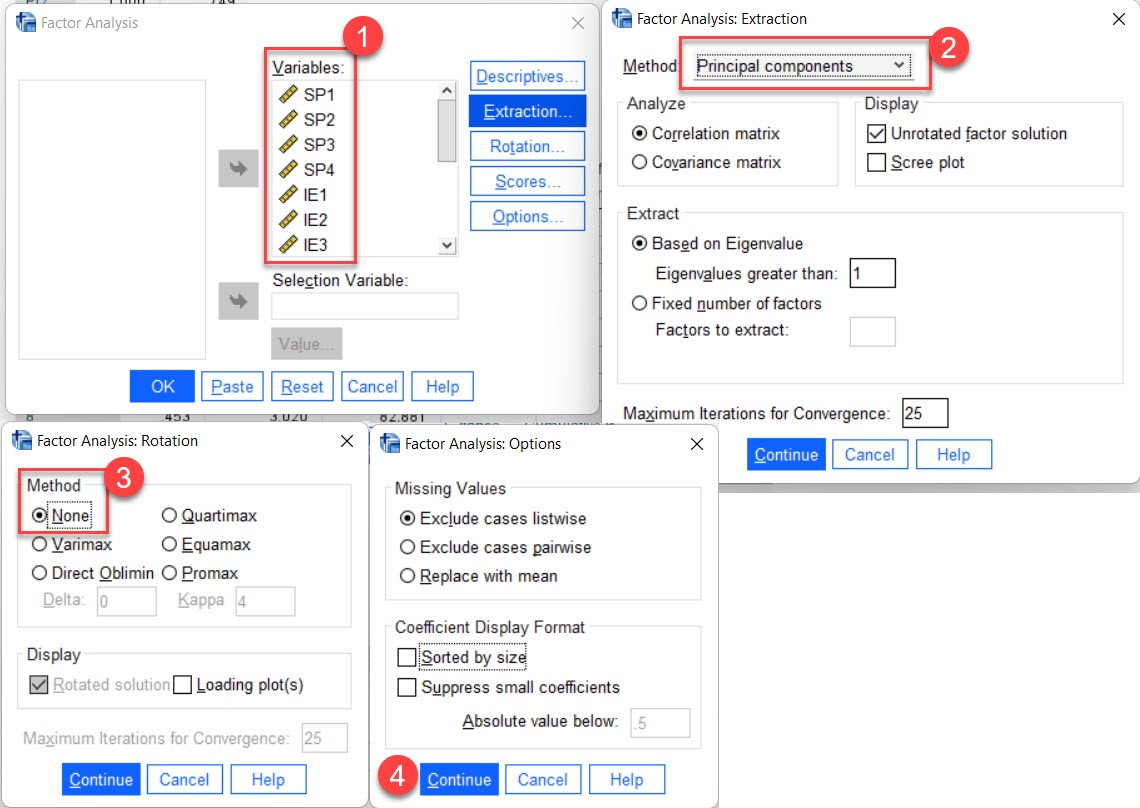
(2) Check the variance of the first component, if it is less than 50% (according to Hair (2019, p744), it is ≤ 40%), then it is concluded that there is no CMV.
In case we run CB SEM with AMOS, we recommend that you perform additional procedures to test the goodness of fit of the single-factor structural model. In case the model fit is low, it proves that CMV is not a concern in your research model. See also Hautala-Kankaanpää (2022).
II. Instructions for implementing Partial Correlation Procedures to test for CMV using SmartPLS
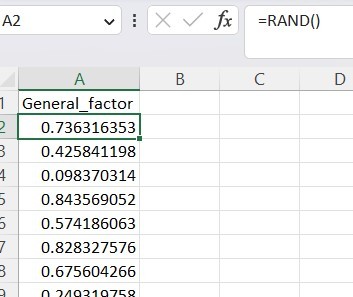
First, we will create the General factor variable by generating random data for this variable.
We will create a correlation between the General factor variable and the dependent variable in the model. Then consider the R2 of the dependent variable before and after adding the General factor variable. If R2 is significantly different, it is concluded that there is a CMV phenomenon in the research data, and vice versa. Note, with models with many dependent variables, create additional relationships between the dependent variable and the General factor variable.
III. Next, we guide you to test CMV for complex models using SmartPLS. This method was introduced by Kock and Lynn (2012), and Kock (2015) gave a level of VIFs ≤ 3.3.
We convert the model to a single-factor form by using latent variables.
First, analyze the original model, get the latent variable value, and create the General factor variable.
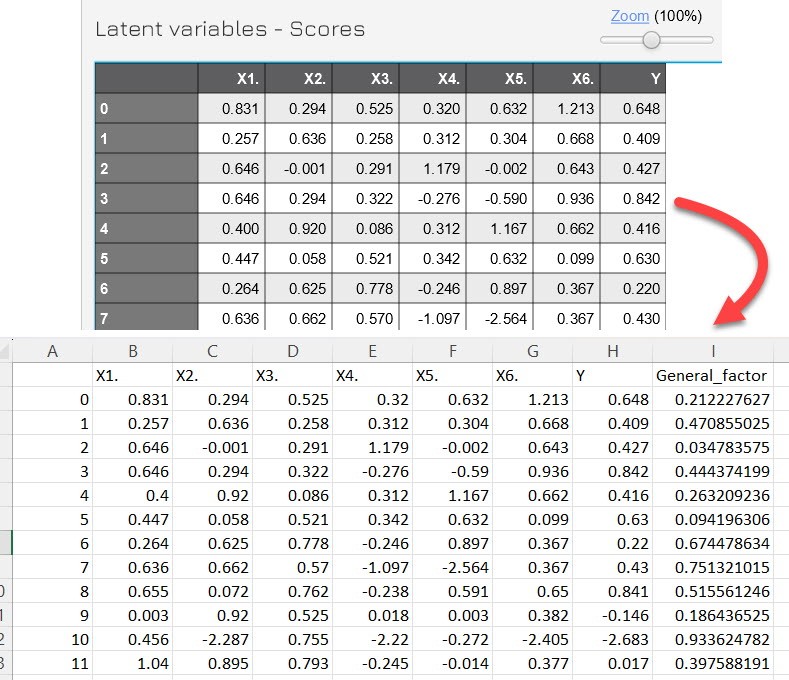
The model is again in single factor form.
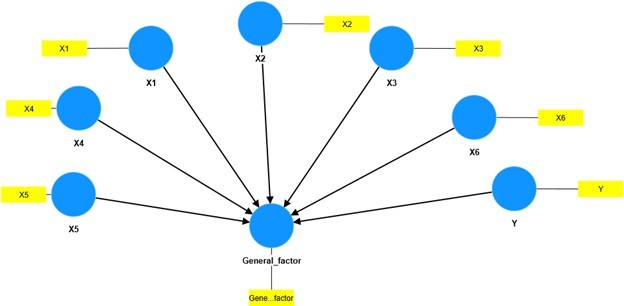
Reading the analysis, we check the VIF value of the endogenous variable model (endogenous variable is the variable with the arrow pointing at it, here is the General factor variable). If this VIF value is less than 3.3 it is concluded that there is no CMV (CMB).
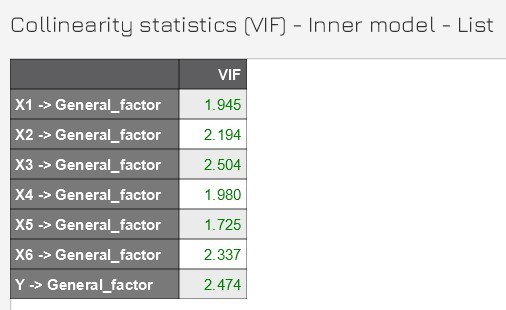
The results showed that the study data did not contain CMV. You can refer to the instructional video for this type of practice by Dr. Ashulekha Gupta here.
In addition, in terms of method, we may not need to convert the variables in the model to single factor form, refer to Dr. James Gaskin for this case here.
References
Change, S., Witteloostuijn, A. V, & Eden, L. (2010). From the editors: Common method variance in international research. Journal of International Business Studies, 41(2), 178–184.
Hair, J. F., Black, W. C., Babin, B. J., & Anderson, R. E. (2019). Multivariate data analysis . Cengage Learning. Hampshire, United Kingdom.
Hautala-Kankaanpää, T. (2022). The impact of digitalization on firm performance: examining the role of digital culture and the effect of supply chain capability. Business Process Management Journal, 28(8), 90–109.
Koch, N. (2015). Common method bias in PLS-SEM: A full collinearity assessment approach. International Journal of E-Collaboration (Ijec), 11(4), 1–10.
Kock, N., & Lynn, G. (2012). Lateral collinearity and misleading results in variance-based SEM: An illustration and recommendations. Journal of the Association for Information Systems, 13(7).
Lindell, M. K., & Whitney, D. J. (2001). Accounting for common method variance in cross-sectional research designs. Journal of Applied Psychology, 86(1), 114.
Podsakoff, P. M., MacKenzie, S. B., Lee, J.-Y., & Podsakoff, N. P. (2003). Common method biases in research: a critical review of the literature and recommended remedies. Journal of Applied Psychology, 88(5), 879.
Tehseen, S., Ramayah, T., & Sajilan, S. (2017). Testing and controlling for common method variance: A review of available methods. Journal of Management Sciences, 4(2), 142–168.