

EVALUATING CONVERGENCE AND DISCRIMINATION IN AMOS CFA ANALYSIS
Testing convergence and discrimination are two important concepts in confirmatory factor analysis (CFA) and testing the validity of the measurement model in the SEM method.
Convergent validity is the ability of measurement indicators to measure the same aspect of the variable being measured. It is tested by measuring the reliability of the measurement indicators and by checking the degree of similarity between the measurement indicators. If the measurement indicators are similar and have high reliability, convergence is confirmed.
Discriminant validity is the ability of metrics to measure distinct aspects of the variable being measured. It is tested by comparing the similarity between the measurements of different variables. If the measurement indices are different, distinctiveness is confirmed.
If the measurement model fails to satisfy both convergent and discriminant properties, this may indicate that the measurement model is inadequate and needs to be revised or revised. If the measurement model does not satisfy convergence, this may indicate that the measurement indicators do not commonly measure an aspect of the variable being measured, or in other words the latent variable in the model is not measured. clearly explained by its observed variables, the possibility that this is an error in determining the scale of the researcher, and to fix this, the researcher needs to re-examine the basis for building the scale, and of course Reliability in survey data also contributes to this error. If the measurement model does not satisfy discrimination, this may indicate that the measurement indicators measure the same aspects of different variables, in simple terms, the latent variable is explained by the external observations are better than its own observations.
To evaluate the above tests, Hair et al (2010) introduced the following criteria:
Convergent Validity
- Composite Reliability (CR) ≥ 0.7.
- Average Variance Extracted (AVE) ≥ 0.5.
Discriminant Validity
+ Maximum Shared Variance (MSV) < Average Variance Extracted (AVE)
+ Square root of average variance extracted Square Root of AVE (SQRTAVE) > Correlations between Inter-Construct Correlations in Fornell and Larcker table.
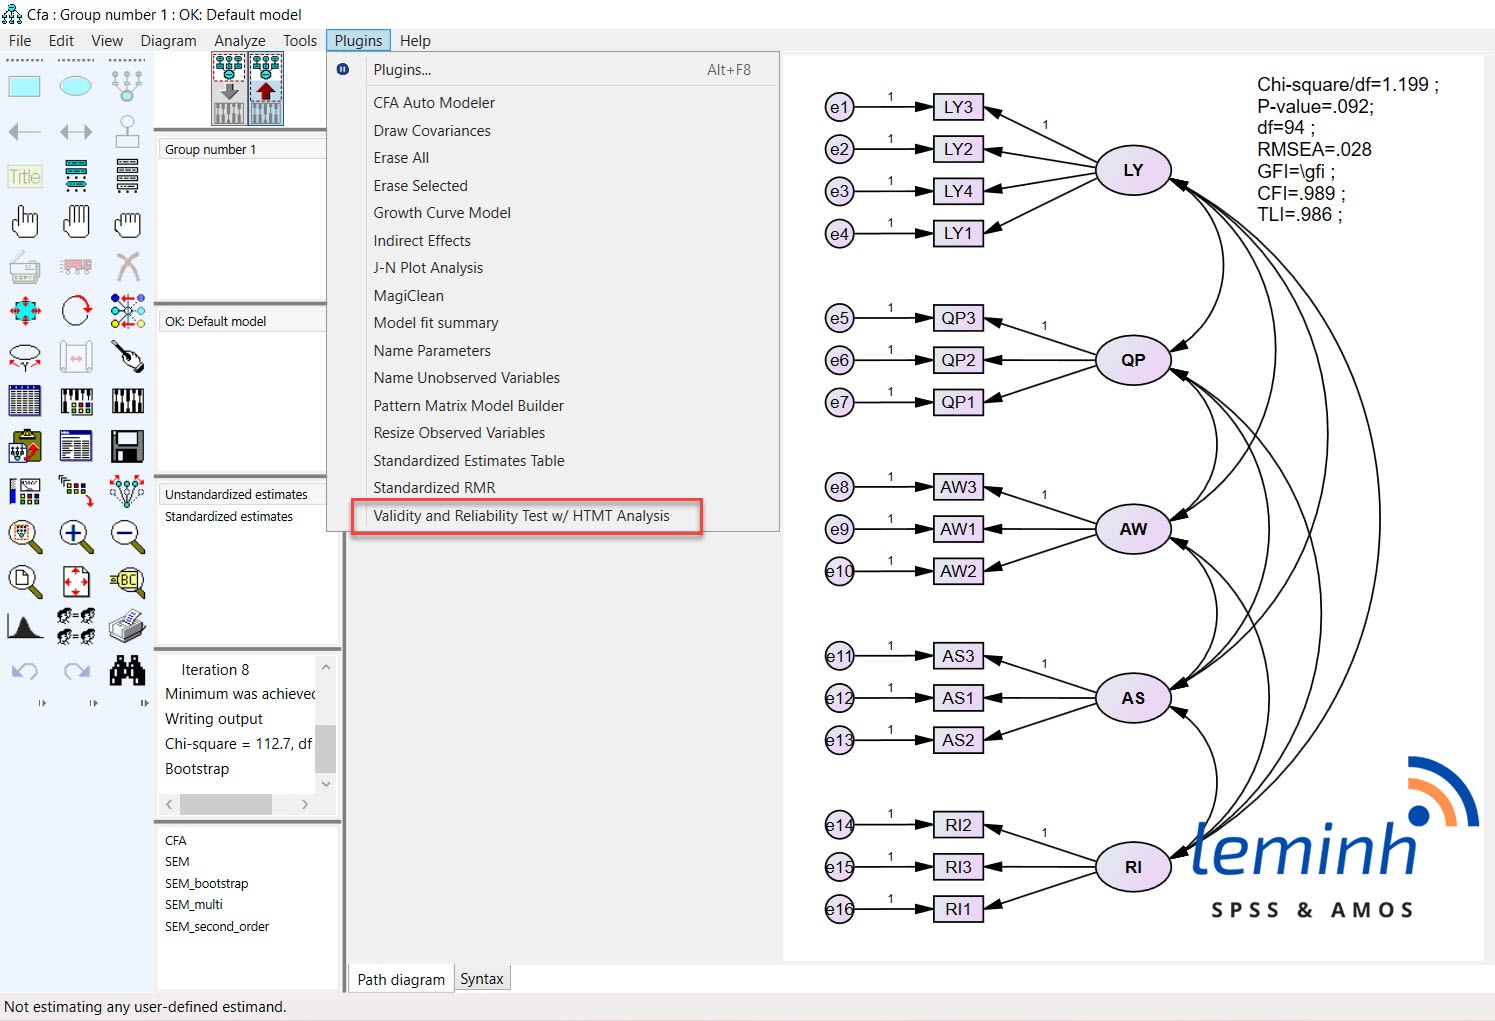
To calculate these indicators in AMOS, we use AMOS 28 software. For the process, you can watch the video below, or follow the steps below.
In the AMOS software, select the Plugins/Validity and Reliability Test w/HTMT Analysis tab. Note, for lower Amos versions that do not have built-in plugins, we need to download plugins compatible with the version to use. Downloads you can see more here.
Kết quả sẽ xuất ra một tệp ở dạng .html, trong đó thể hiện các kết quả về Độ tin cậy tổng hợp (CR); Phương sai trung bình (AVE); giá trị MSV (Maximum Shared Variance); MaxR(H).
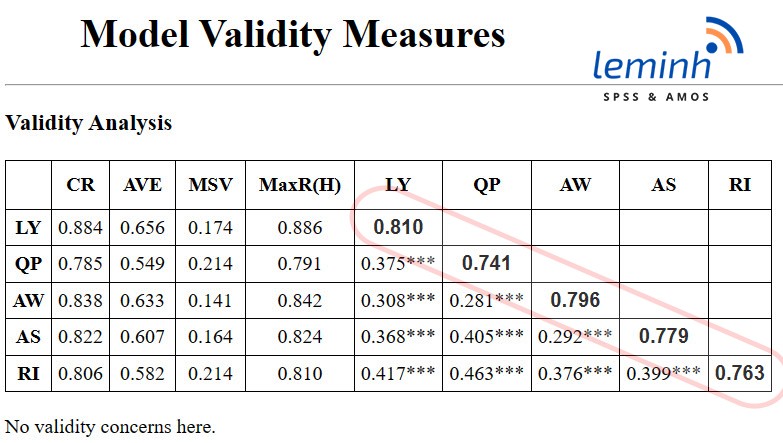
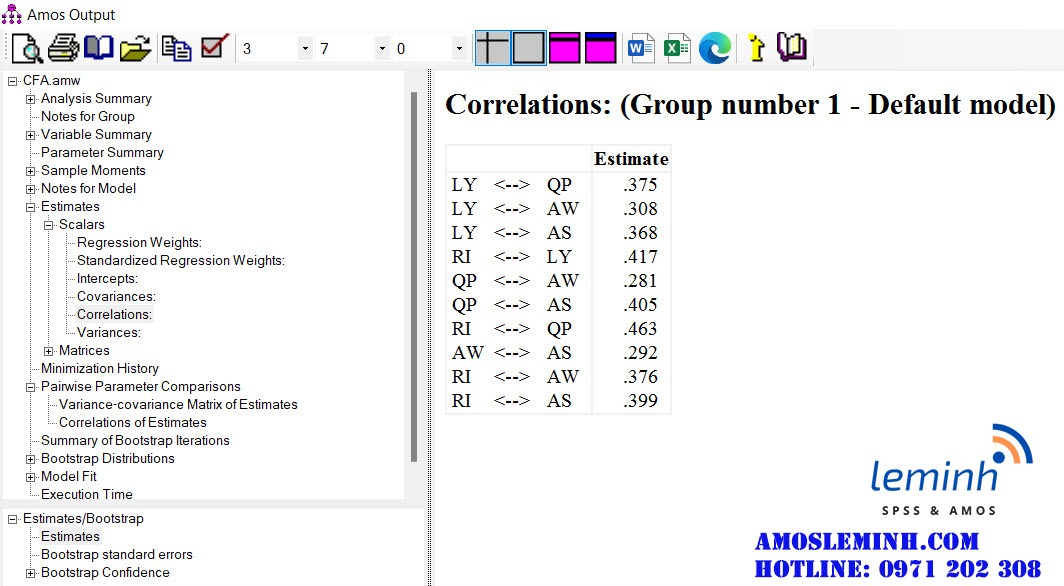
Anh chị lưu ý, các giá trị đường chéo chính là căn bậc 2 của AVE nhé, các phần tử còn lại của ma trận chính là hệ số correlations khi chạy CFA nhé.
Đang update tiếp…
Tài liệu tham khảo:
Hair, J., Black, W., Babin, B., and Anderson, R. (2010). Multivariate data analysis (7th ed.): Prentice-Hall, Inc. Upper Saddle River, NJ, USA.
Malhotra N. K., Dash S. (2011). Marketing Research an Applied Orientation. London: Pearson Publishing.
Video hướng dẫn cách chạy các kiểm định trên dưới đây.