

INSTRUCTIONS FOR MULTI-GROUP STRUCTURAL ANALYSIS USING SmartPLS SOFTWARE
(PART 1 – BASICS)
♦ Before the arrival of SmartPLS 4, older versions of SmartPLS only allowed users to analyze PLS SEM models. However, SmartPLS version 4 has integrated analysis techniques for the CB SEM model in parallel with the PLS SEM model. If you use AMOS to analyze the multi-group structure for the CB SEM model, the procedure will be more cumbersome. We will present in detail the MGA procedure for CB SEM using AMOS in another article. In this article, we will detail the multi-group structural analysis procedure for the PLS SEM model using SmartPLS 3 software.
♦ Multi-group structural analysis has the purpose of determining whether the influence of control variables (age, gender, education level, etc.) or moderating variables on the correlations in the research model . This will help determine whether the correlations differ between different groups of factors. It’s a bit confusing, but the meaning is the same as T-test or Anova-one-way analysis.
♦ To do this, do the following:
♦ Basically, to analyze multi-group structural models, you need to convert them to grouped variables. Qualitative variables are all grouping variables. For example: gender has two groups: male and female, the same goes for level or age. Quantitative variables are not essentially grouped variables, they are on a scale, so to analyze the multi-group structure for quantitative variables, you need to convert them to grouped form (hypothetical variable). count). For example: The Entrepreneurial Attitude variable uses a 7-point Likert scale to measure, it is a moderating variable in the model. You need to convert it to grouping based on the average value (mean) or middle position (median). For example:
| Attitude change (TD) | Mean | Median | |||||
| TD1 | TD2 | TD3 | TD4 | TD5 | |||
| 1 | 5 | 7 | 7 | 4 | 4.80 | 5 | |
| Median needs to be sorted again and then take the middle number. If the number of elements is even, median will take the average of the two middle numbers, for example: | |||||||
| Attitude change (TD) | Median | ||||||
| TD1 | TD2 | TD3 | TD4 | TD5 | TD6 | ||
| 1 | 5 | 7 | 7 | 4 | 3 | 4.5 | |
♦ Here, the attitude variable is divided into 2 groups based on mean. If the mean is less than the average of the 7-point Likert scale (4), then it is classified as having an unpositive attitude, and vice versa, it is classified as having a positive attitude. So, you have converted the quantitative changes into dummy variables for multi-structural analysis.
♦ For example, here we have a PLS SEM model consisting of 4 independent variables, 3 control variables, and 1 dependent variable LY (loyalty) as follows:
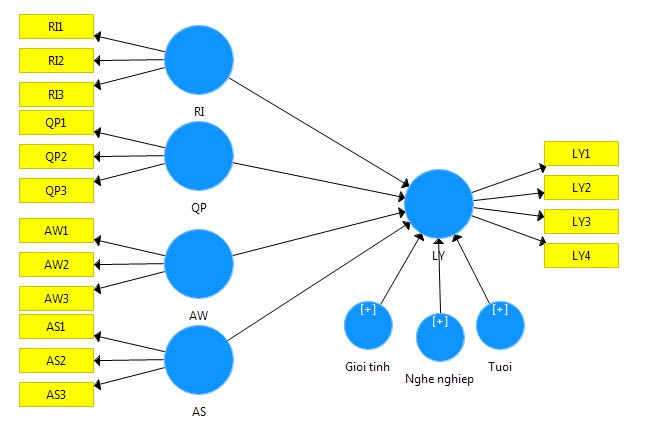
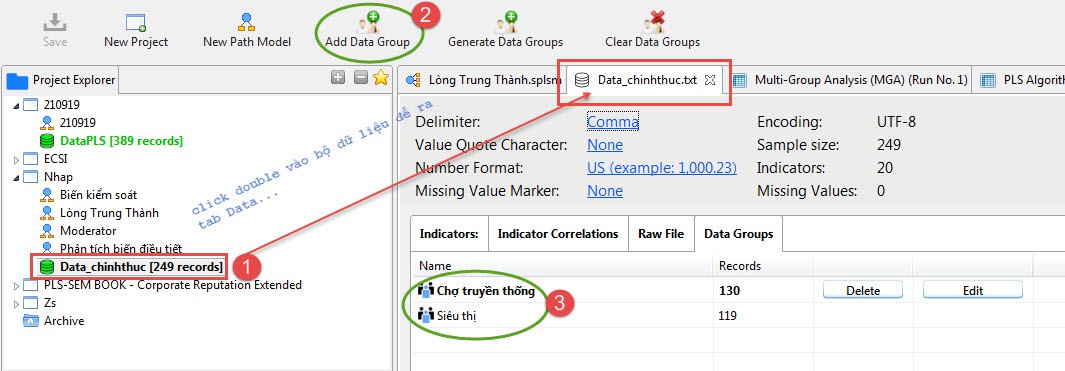
♦ We need to analyze the influence of factors that impact customer loyalty in each buying group, here we have 2 buying groups: the group buying in traditional markets and the group buying in supermarkets . Please note that with each MGA analysis, we should select each pair of groups one at a time to analyze it so that it is less confusing.
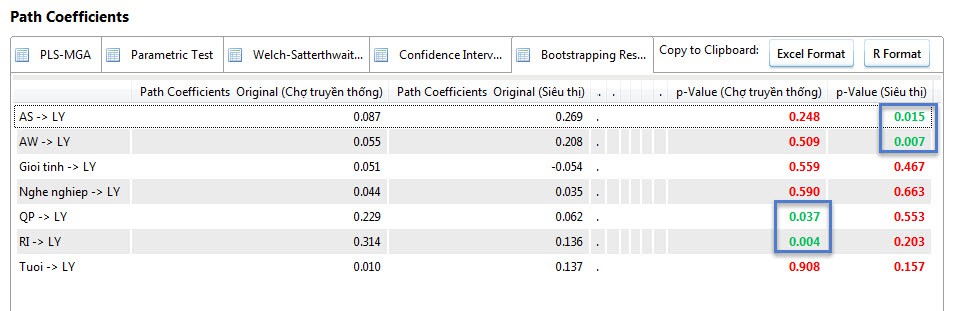
♦ Thus, for the supermarket buying group, only AS and AW have an influence on their Loyalty. As for the group that buys in traditional markets, QP and RI have an impact on loyalty. Based on these results, managers offer solutions to enhance loyalty for their customers that are suitable for each specific buying group.
♦ The above is just the basic theory of MGA. In the following topic, we will present the advanced MGA for both CB SEM and PLS SEM models running on AMOS & SmartPLS platforms in a more complete and in-depth way.