

INDICATORS USED FOR MEASUREMENT IN PLS SEM MODEL
- GoF index (Goodness of fit)
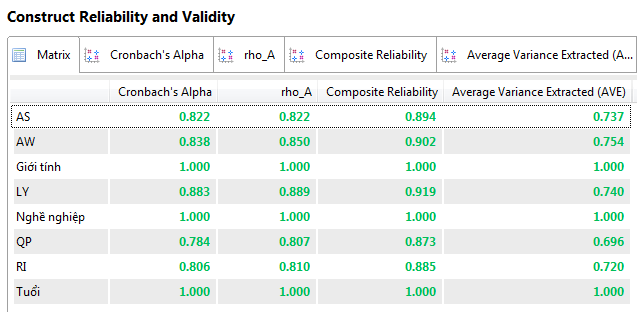
In the PLS SEM model there is an index to measure model fit called Goodness of fit – GoF. GoF was introduced in 2004 by Tenenhaus et al to measure the PLS (Partial least squares) path model. The GoF index has a value between 0 and 1, the closer it is to 1, the better the model fits. Now I will calculate this index based on the model illustrated below.
After running the model, you need to extract the data
The GoF index is calculated using the formula:

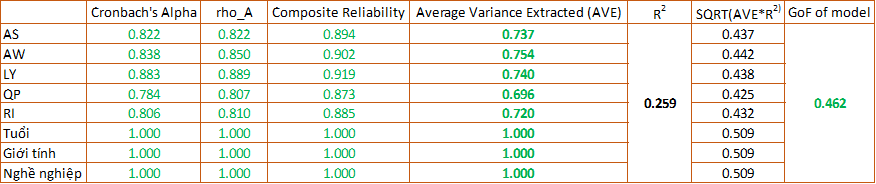
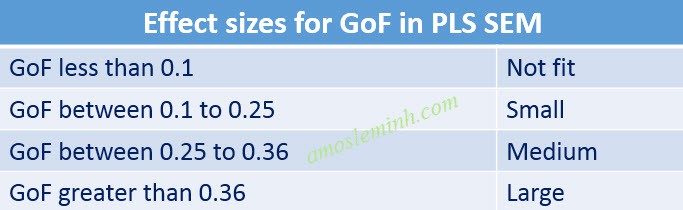
Thus, we have calculated one of the indices measuring the fitness of the PLS SEM model. The GoF value of 0.462 is considered to be a model with great fit to the research data set, the level of strength and weakness is assessed on the basis of Wetzels et al. (2009).
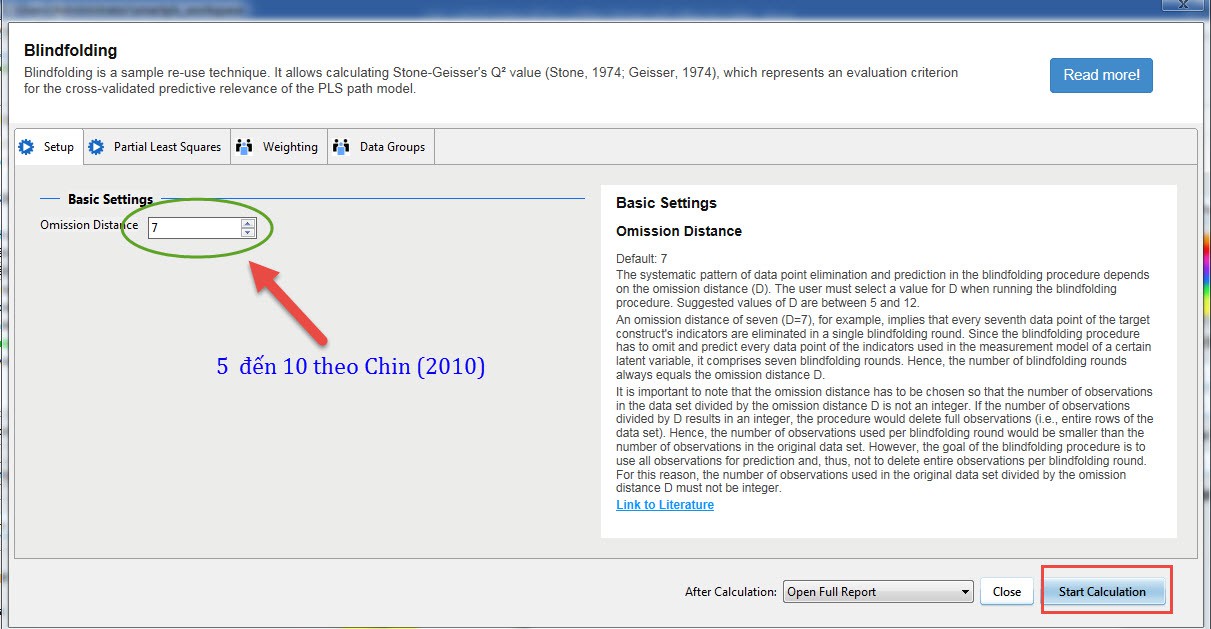
- Q2 Index (Predictive Relevance)
The Q2 index is the result when you run the Blindfolding procedure, it predicts whether the research model is suitable or not. When running the Blindfolding procedure, there will be 2 result tables containing Q2, the first is Cross Validated redundancy, the second is Cross validated communality. We are only interested in the results from the first Cross Validated redundancy table. According to Fornell and Cha (1994), if the Q2 value is > 0, the model is considered to have a good fit, and conversely, the model is predicted to have a poor fit.
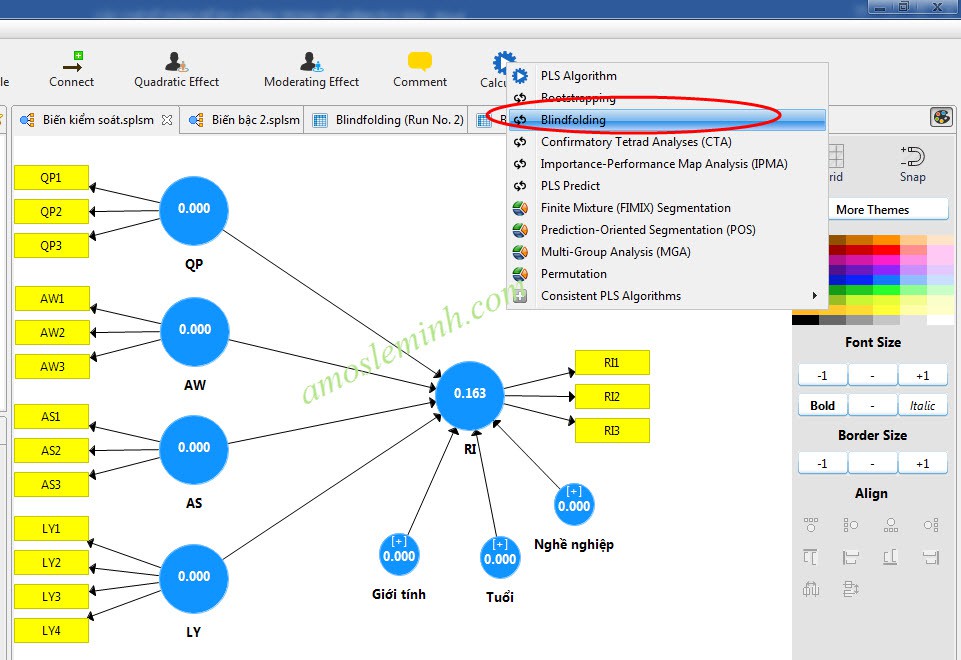
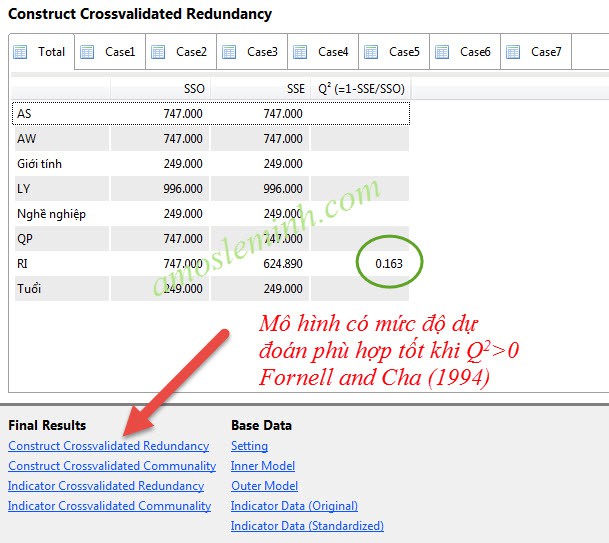
The results of the analysis of the example output from SmartPLS as above showed that the model was predicted to have a good fit.
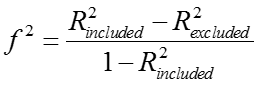
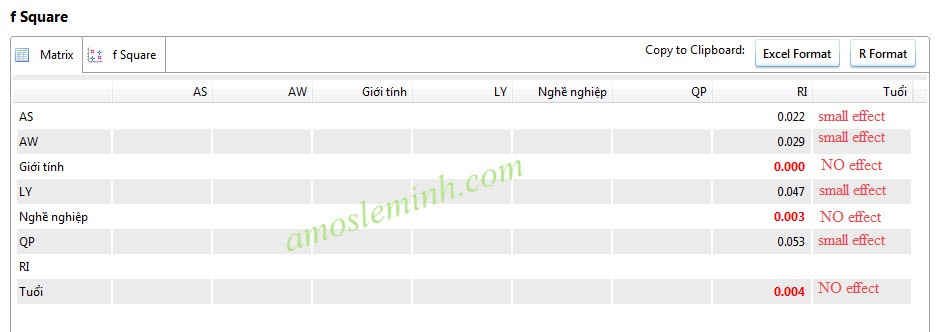
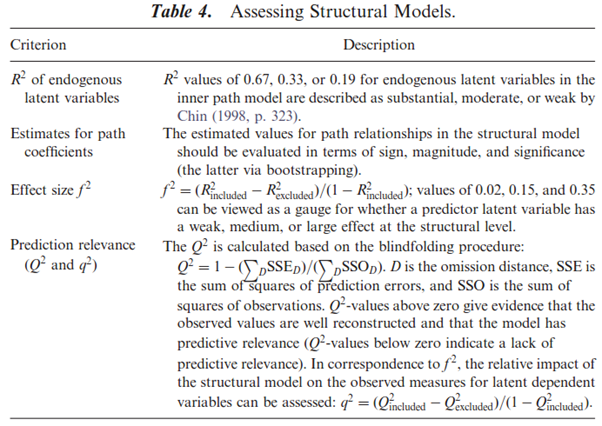
- f2 index (Predictive Relevance)
Chin (1998) said that the relative influence of a particular exogenous latent variable on endogenous latent variables is equal to the change in R2. The index f2 is calculated by increasing the R2 of the latent variable with the connected path, or in other words f2 is calculated for each specific pair of correlations.
The f2 index is calculated according to the following formula:
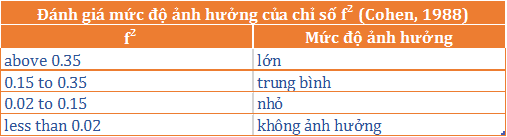
The level of impact is assessed as follows:
Results from the original example:
Excerpted from Henseler, Ringle & Sinkovics (2009)
References
Chin, W. W. (1998). The least partial squares approach to structural equation modeling. Modern Methods for Business Research, 295(2), 295–336.
Chin, W. W. (2010). How to write up and report PLS analyses. In Handbook of partial least squares (pp. 655–690). Springer.
Fornell, C., & Cha, J. (1994). Partial Least Squares. Advanced Methods of Marketing Research, RP Bagozzi. Cambridge, Blackwell.
Henseler, J., Ringle, C. M., & Sinkovics, R. R. (2009). The use of partial least squares path modeling in international marketing. In New challenges to international marketing. Emerald Group Publishing Limited.
Tenenhaus, M., Amato, S., & Esposito Vinzi, V. (2004). A global goodness-of-fit index for PLS structural equation modeling. In Proceedings of the XLII SIS scientific meeting (Vol. 1, pp. 739–742).
Wetzels, M., Odekerken-Schröder, G., & Van Oppen, C. (2009). Using PLS path modeling for assessing hierarchical construct models: Guidelines and empirical illustration. MIS Quarterly, 177–195.