
STATISTICAL PROCESSING WITH STATA SOFTWARE
STATA is a software used in Quantitative and Statistical Analysis. STATA is programmed on C++ platform. STATA uses direct commands, each command can be entered at a time for execution (at the start time) or can be compiled into a program that includes multiple commands to be executed at the same time. Even if a program error occurs, it can be easily identified and corrected.
STATA is very strong in data analysis (data table) with GMM model, 2SLS model, 3SLS model, high speed, logic analysis, flexible process processing, helping users process data. and specifically statistical analysis.

Advantage
– Allows complex data operations to be performed with ease.
– STATA’s greatest strengths are regression (very easy to use regression prediction tools), logistic regression (new additions simplify the interpretation of logistic regression results, and second logistic regression sequential and categorical logistic regression are very easy to perform).
– STATA also has many easy-to-use robust estimation methods, including robust regression and regression with robust standard errors, and many other estimation commands with robust standard errors.
– STATA also excels in the field of data analysis according to sample schema, giving the ability to apply them in analyzing survey data by regression tools, logistic regression, poisson regression, probit regression,…
– STATA plots also have additional functionality for statistical analysis, for example there are many commands that simplify the creation of regression diagnostic plots.
– The syntax of graph commands is the easiest to use among the three suites of programs and also the most powerful. The STATA graphs are of high quality and the quality of the publication is also high.
Defect
– STATA does not have the same powerful data management capabilities as SAS, but its data management commands still have a lot of power, and are very simple.
– However, STATA can only work with one data file at a time, so processing tasks that require multiple data files at the same time are more complicated for STATA.
– The weakest point is the ability to analyze variance and traditional multidimensional analysis such as multidimensional variance analysis and group analysis.
– STATA graphs cannot be edited with the graph editor
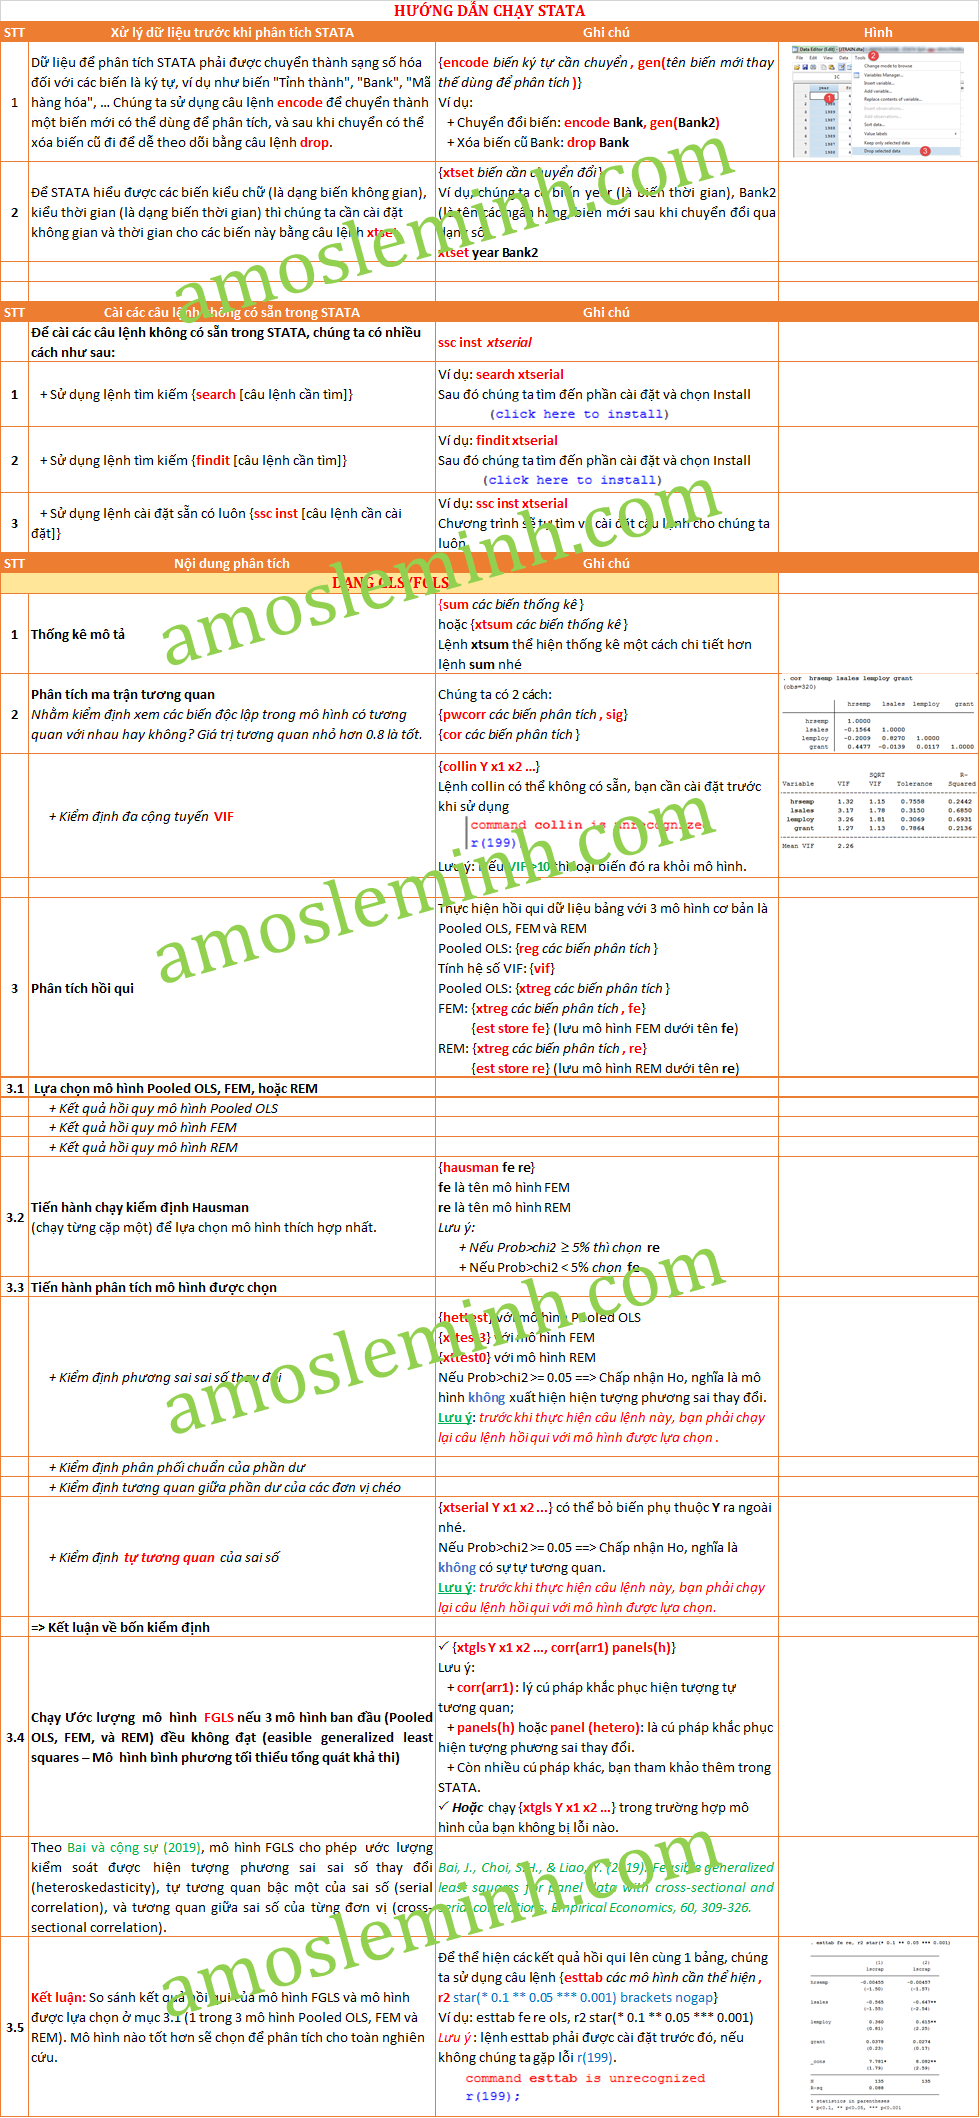
The following are the main contents commonly found in panel data analysis using STATA
Below is the command structure commonly used in STATA for everyone to follow. N
If you have difficulty with data, please contact Le Minh Data Analysis Service. We will support data analysis and processing for you, and can also support data collection in cases where you do not have a data set or the data set is missing a lot.