

GUIDELINES FOR ANALYZING REGULATING VARIABLES IN HIGH-LEVEL MODELS (AMOS & SmartPLS APPLICATIONS)
(PART 2 – ADVANCED)
Hello guys! Because the article is highly academic, if you copy it, please note the source amosleminh.com to help us.
Today, we will guide you to perform moderator variable analysis in a high-order model. The model we study today has the following form:
For the first-order model, we also had the opportunity to present the analysis of moderator variables in detail to you in older topics at amosleminh.com. Within this topic, we will focus on guiding you how to analyze a second-order model containing moderating variables. We will have 2 basic cases as follows:
Case 1: The moderator variable that governs the relationship between the two variables is both level 1.
Case 2: The moderating variable governs the relationship between two variables whose cause variable is a higher-order variable (specifically, we often encounter it as a second-order variable). As in the research model above, the CTCV variable is a second-order cause variable that impacts the dependent variable, the outcome variable. The variable KG (Workspace) moderates the relationship from Job Stress (CTCV) to Job Performance Results (KQ).
For case 1, although the model is a high-order model, the controlling variable relationship does not contain a high-order variable, so we analyze the problem of the influence of the moderator variable similarly to the high-order model. first.
For case 2, analyzing the problem of the influence of the moderating variable will be difficult because we will have trouble calculating the interaction term value. In this case, we will guide you how to analyze two popular models: CB SEM running on AMOS platform and PLS SEM running on SmartPLS platform.
I. For PLS SEM model
Nowadays there are many applications that perform PLS SEM model type analysis such as ADANCO, SmartPLS, R, etc. However, in Vietnam, the most popular application is SmartPLS (latest version to date is 4.0.9.5).
In this topic, we use SmartPLS 4.0.9.2. The most outstanding feature of SmartPLS is its ease of use during model deployment. Including the moderating variable, the implementer does not need to manually calculate the value of the interaction cluster to include in the model, but only needs to do so by pointing the arrow to the relationship that needs to be analyzed. The program will automatically calculate the value of the interaction cluster, this is done even for 2nd order variables. Because SmartPLS will calculate the latent value of 2nd order variables (a type of variable that is not directly measured). by observations (items)) and convert them to first-order form. Here, we will perform a two-stage analysis process to bring the higher-order model to first-order form.
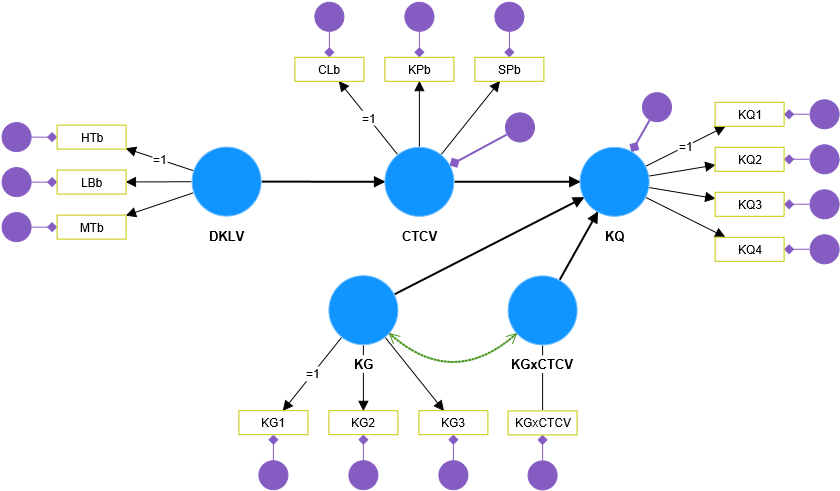
We will not provide detailed instructions on how to analyze high-level models here, because this is an old topic, you can refer to amosleminh.com for more information. We will switch back to the low-level model and start analyzing moderating variables similar to case 1. The converted model has the following form:
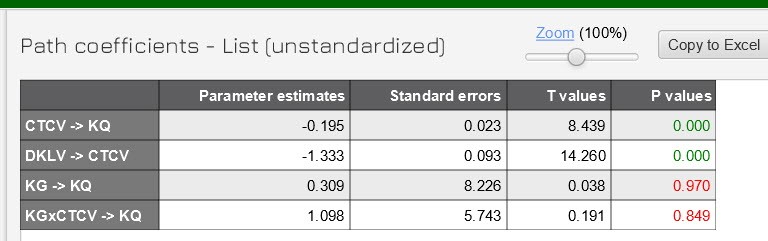
The analysis results are as follows:
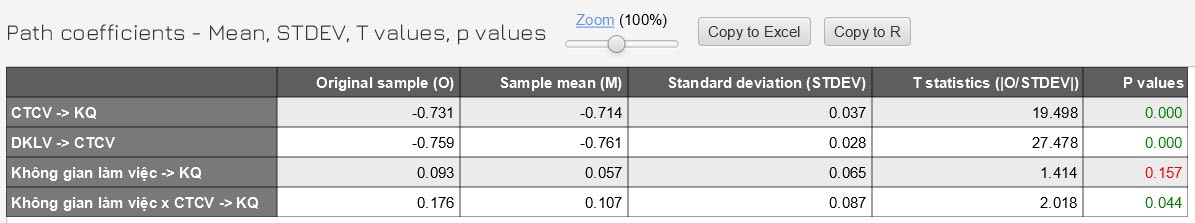
We see that the P values of the interaction cluster Workspace x CTCV → Outcome is less than 5%, so we can conclude that Workspace has a moderating influence on the relationship from Job Stress to Performance. employee job performance.
Analyzing the slope of the influence of the moderator variable, it can be seen that, when work stress is high, the better the working space, the less work stress affects work performance. For example, at CTCV position 1, the better the workspace, the higher the work performance. However, when employees work with less stress, the better the workspace will result in reduced work performance (but the rate of change in this range is not high). You can analyze further using spotlight or floodlight graphs as we instruct in older topics at amosleminh.com.
II. For CB SEM model
The CB SEM model is similar to the PLS SEM model, but the difference lies in the tool used to analyze the model. Basically, as we have said many times, we have to switch from the high-order model to a first-order model. After switching back to the first-order form, we then proceed to analyze the influence of the moderating variable. .
II.1. Runs with SmartPLS
Since SmartPLS version 4.0.9.2, the CB SEM model is supported for analysis. One of the strengths of this application is that it can calculate for us the value of the latent variable (although up to now there has been no official research to test its accuracy. But this is the basis for our implementation).
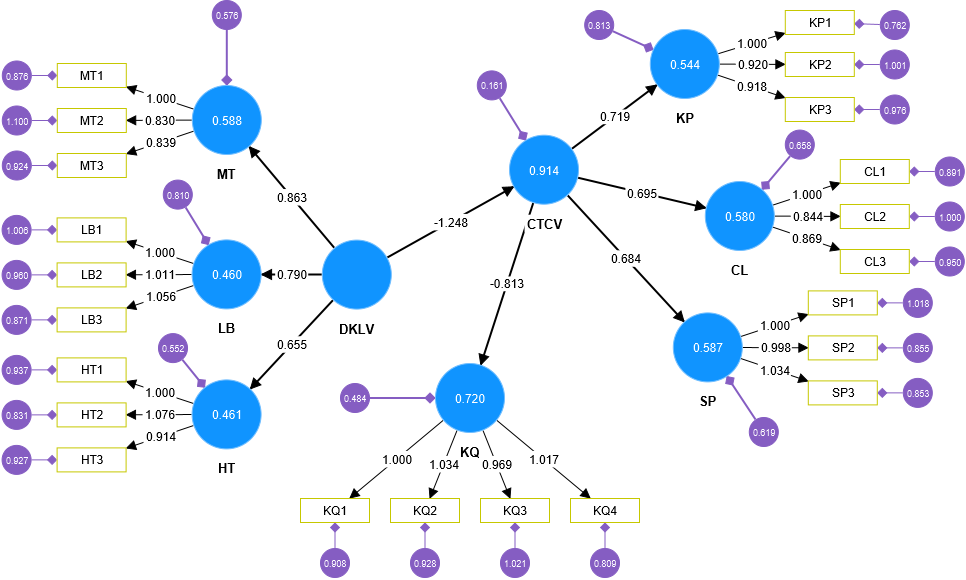
The high-level CB SEM model running with SmartPLS is as follows:
Convert to first-order form based on path analysis based on factor scores value.
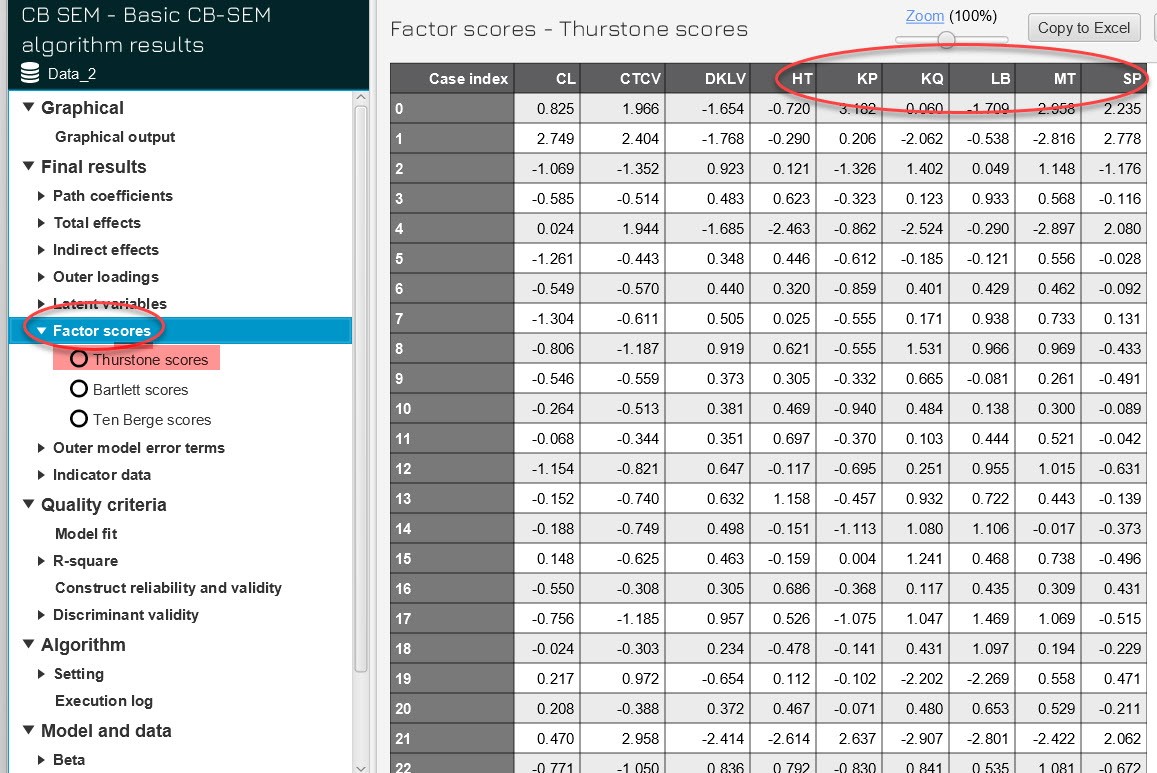
According to our experience, the program offers 3 score value tables, we should choose Thurstone scores. Because, when compared with PLS SEM, we found that its value is closer to the value of latent variables in the PLS algorithm.
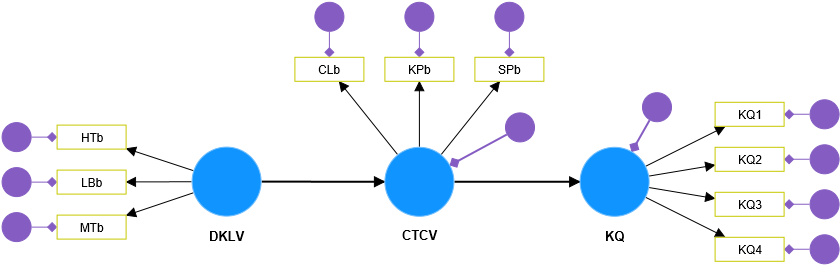
The model is converted to first-order form as follows:
At this point, we include the moderator variable as a first-order model analysis. Please note, this is also done on SmartPLS 4.0.9.2, but for PLS SEM the program will support moderator variable analysis by modeling image directly into the program. However, for CB SEM running on SmartPLS 4.0.9.2 application, direct modeling of moderator variables is not supported. Therefore, we must perform manual simulation according to theory, by calculating the interaction cluster CTCV x KG, and putting it into the model as follows:
The results of CB SEM analysis show that the moderator variable in the case of CB SEM model does not affect the relationship from CTCV to results.
II.2. Runs on AMOS
In case the high-level model CB SEM runs on AMOS, the analysis story will be different. Because calculating the value of the latent variable is complicated and difficult, in this case we cannot analyze the moderator variable in the usual way, but we must convert it to MGA form to evaluate the influence of the moderator variable. in the model.
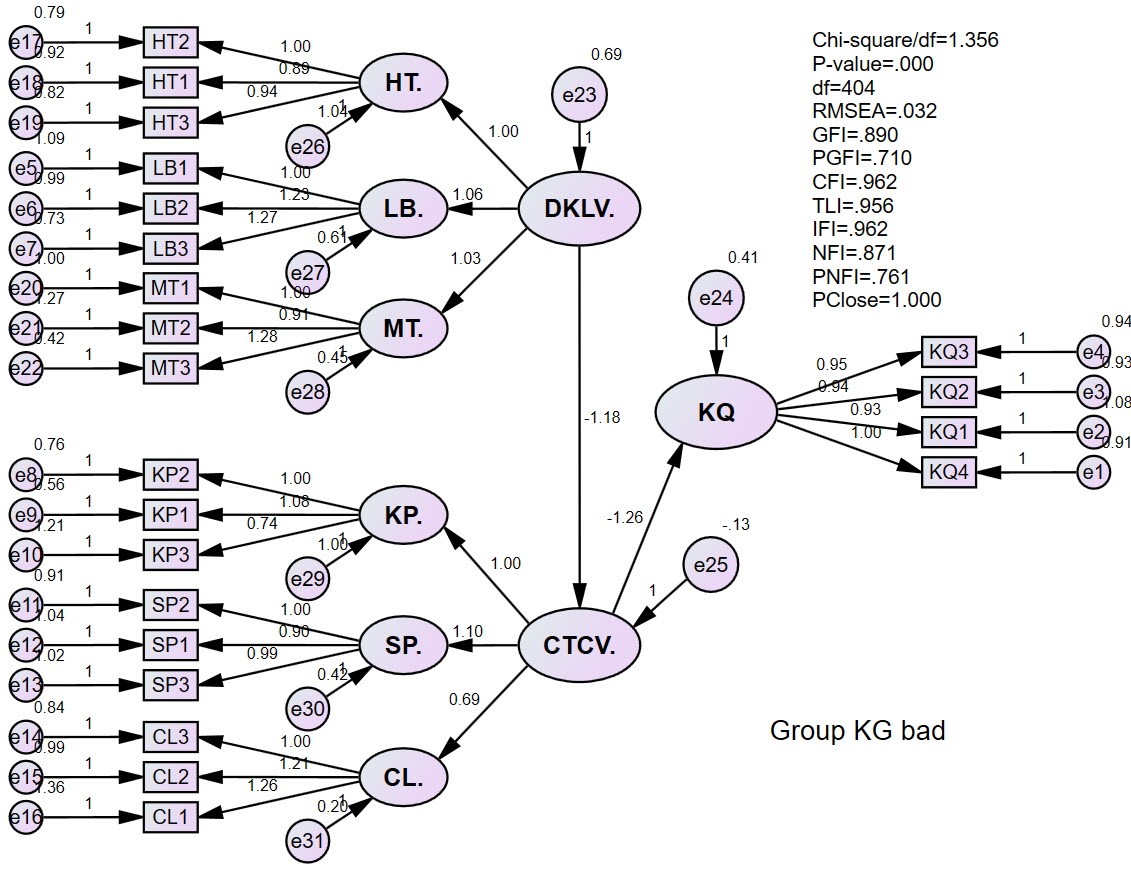
The Workspace variable has a 7-point likert scale, so here we will divide 2 trends into 2 groups to run MGA.
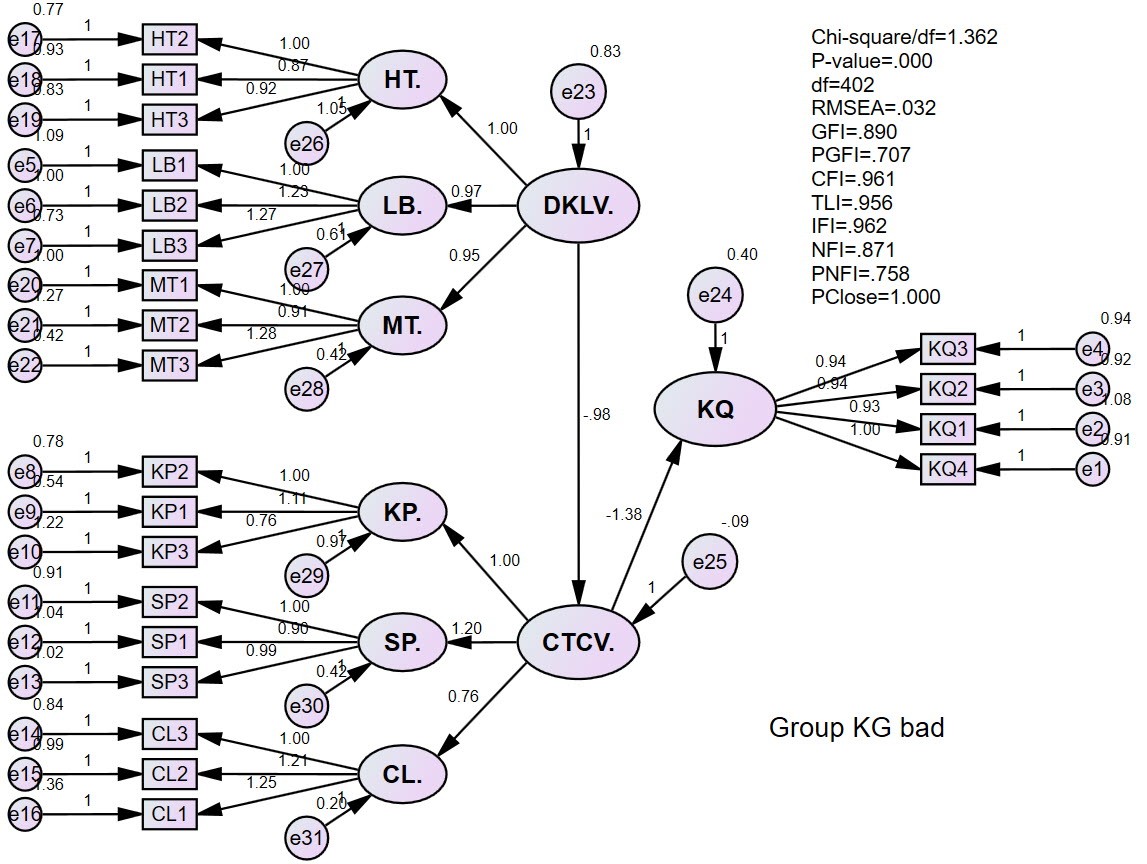
Group 1: has an average value of the Workspace variable ≤4, meaning the workspace is poor. We named this group Group KG bad.
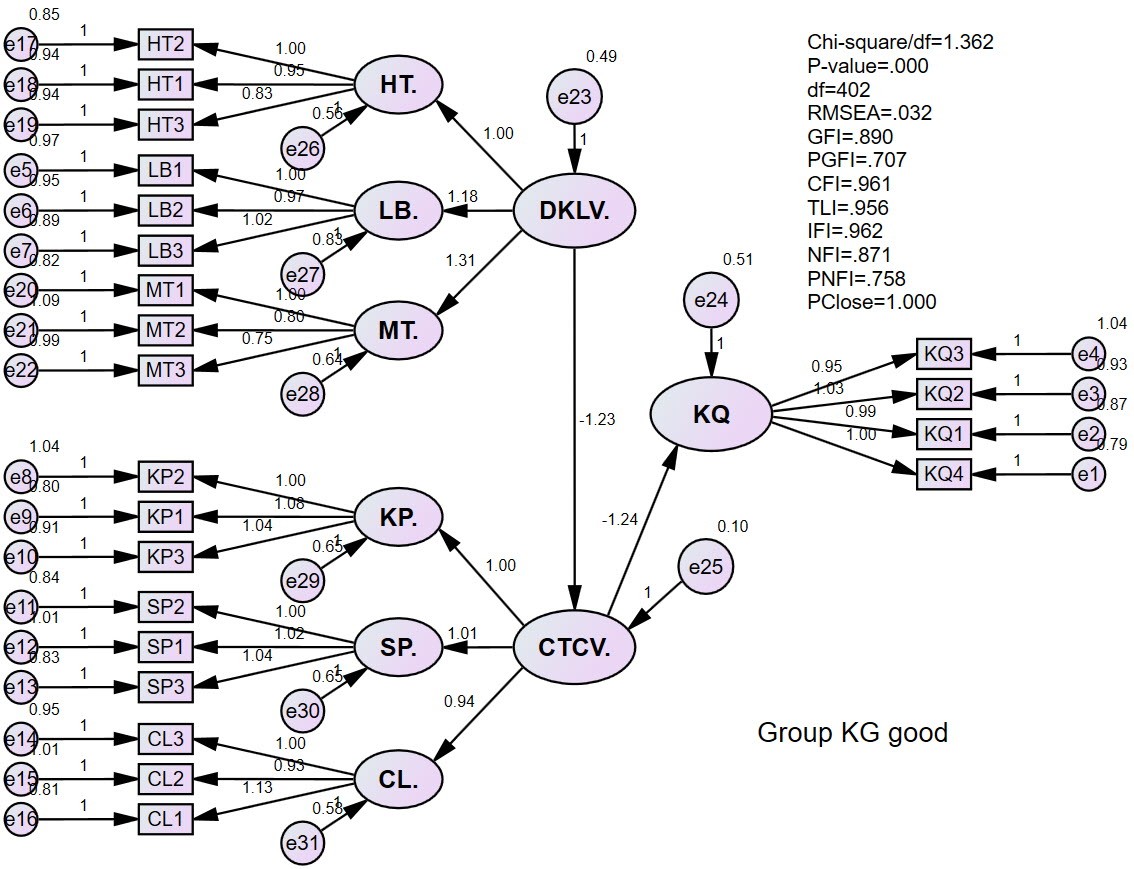
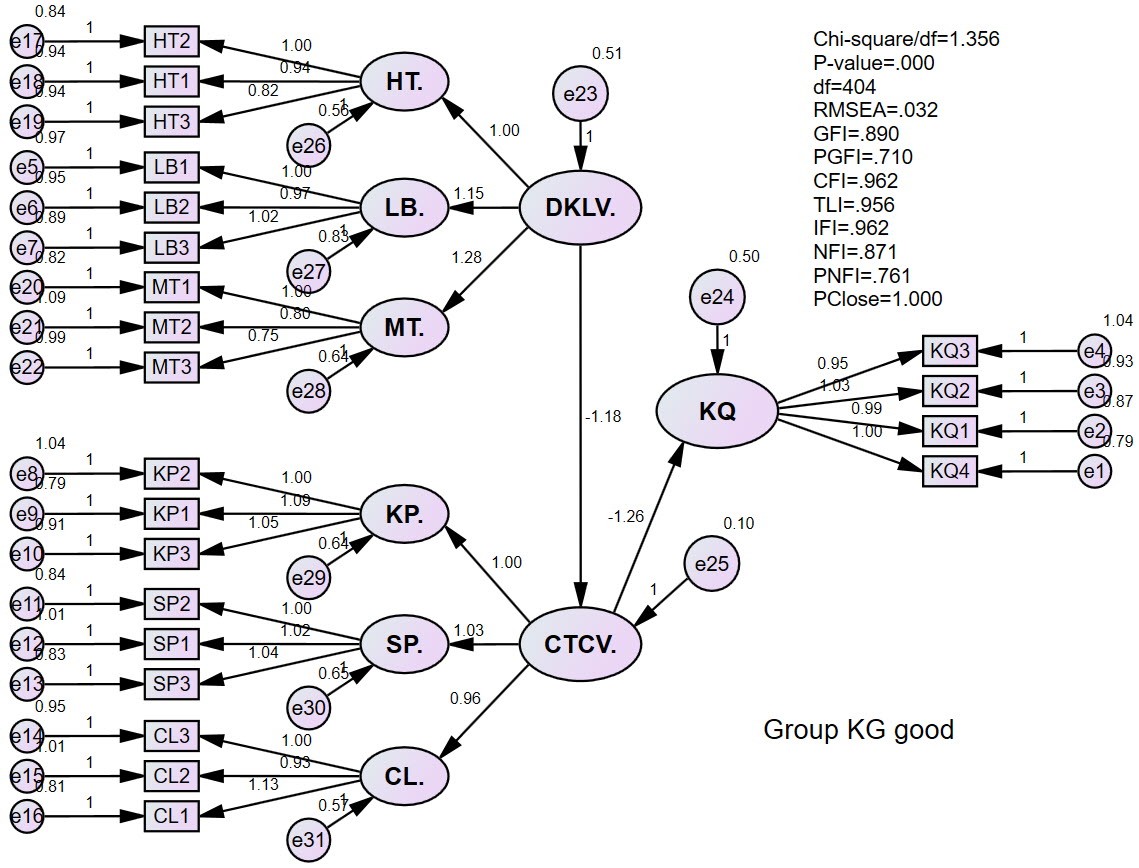
Group 2: has an average value of the Workspace variable >4, meaning a good workspace. We named this group Group KG good.
The testing results of the variable model are as follows:
The testing results of the invariant model are as follows:
Model selection results:
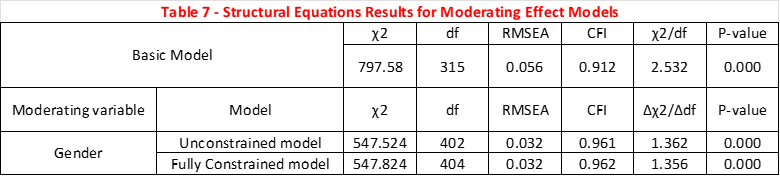
The results of model selection analysis show that the Invariant Model is selected. This means that between groups there are no statistically significant differences in the research model. That is, Workspace does not play a moderating role on the relationship from CTCV → Outcome.
References:
DiStefano, C., Zhu, M., & Mindrila, D. (2009). Understanding and using factor scores: Considerations for the applied researcher. Practical Assessment, Research, and Evaluation, 14(1), 20.
Hair Jr, J. F., Sarstedt, M., Ringle, C. M., & Gudergan, S. P. (2017). Advanced issues in partial least squares structural equation modeling. saGe publications.
Hayes, A. F. (2022). Introduction to mediation, moderation, and conditional process analysis: A regression-based approach. Guilford publications.
Sarstedt, M., Hair Jr, J. F., Cheah, J.-H., Becker, J.-M., & Ringle, C. M. (2019). How to specify, estimate, and validate higher-order constructs in PLS-SEM. Australasian Marketing Journal, 27(3), 197–211.