

GUIDELINES FOR MULTI-GROUP STRUCTURAL ANALYSIS (MGA)
PART 2 – ADVANCED
I. APPLY MICOM PROCEDURE BEFORE MULTI-GROUP ANALYSIS
In this section, we will focus on solving the MGA problem in PLS SEM. According to Hair et al (2017), the main concern before performing multigroup analysis is ensuring measurement invariance, also known as measurement equivalence. By establishing measurement invariance, researchers can be confident that between-group differences in model estimates using the MGA procedure do not result from the content or unique meaning of the latent variables between groups (Hair et al., 2017). Also according to Hair et al. (2017), when the model does not ensure measurement invariance, it can weaken the results of statistical tests, affecting the accuracy of estimates, and cause the results to become misleading. Therefore, before performing the MGA procedure, we need to test the measurement invariance to ensure the accuracy of the estimation results in MGA.
For CB SEM models to assess measurement invariance, researchers often use multigroup confirmatory factor analysis based on the guidelines of Steenkamp & Baumgartner (1998) and Vandenberg & Lance (2000 ). However, applying this method to the PLS SEM model is not easy. As a result, Henseler et al (2016) developed the measurement invariance of composite models (MICOM – Measurement invariance of composite models) procedure. The MICOM procedure is constructed based on the scores of the latent variables.
Figure 1 – MICOM procedure presented according to Hair et al (2017)
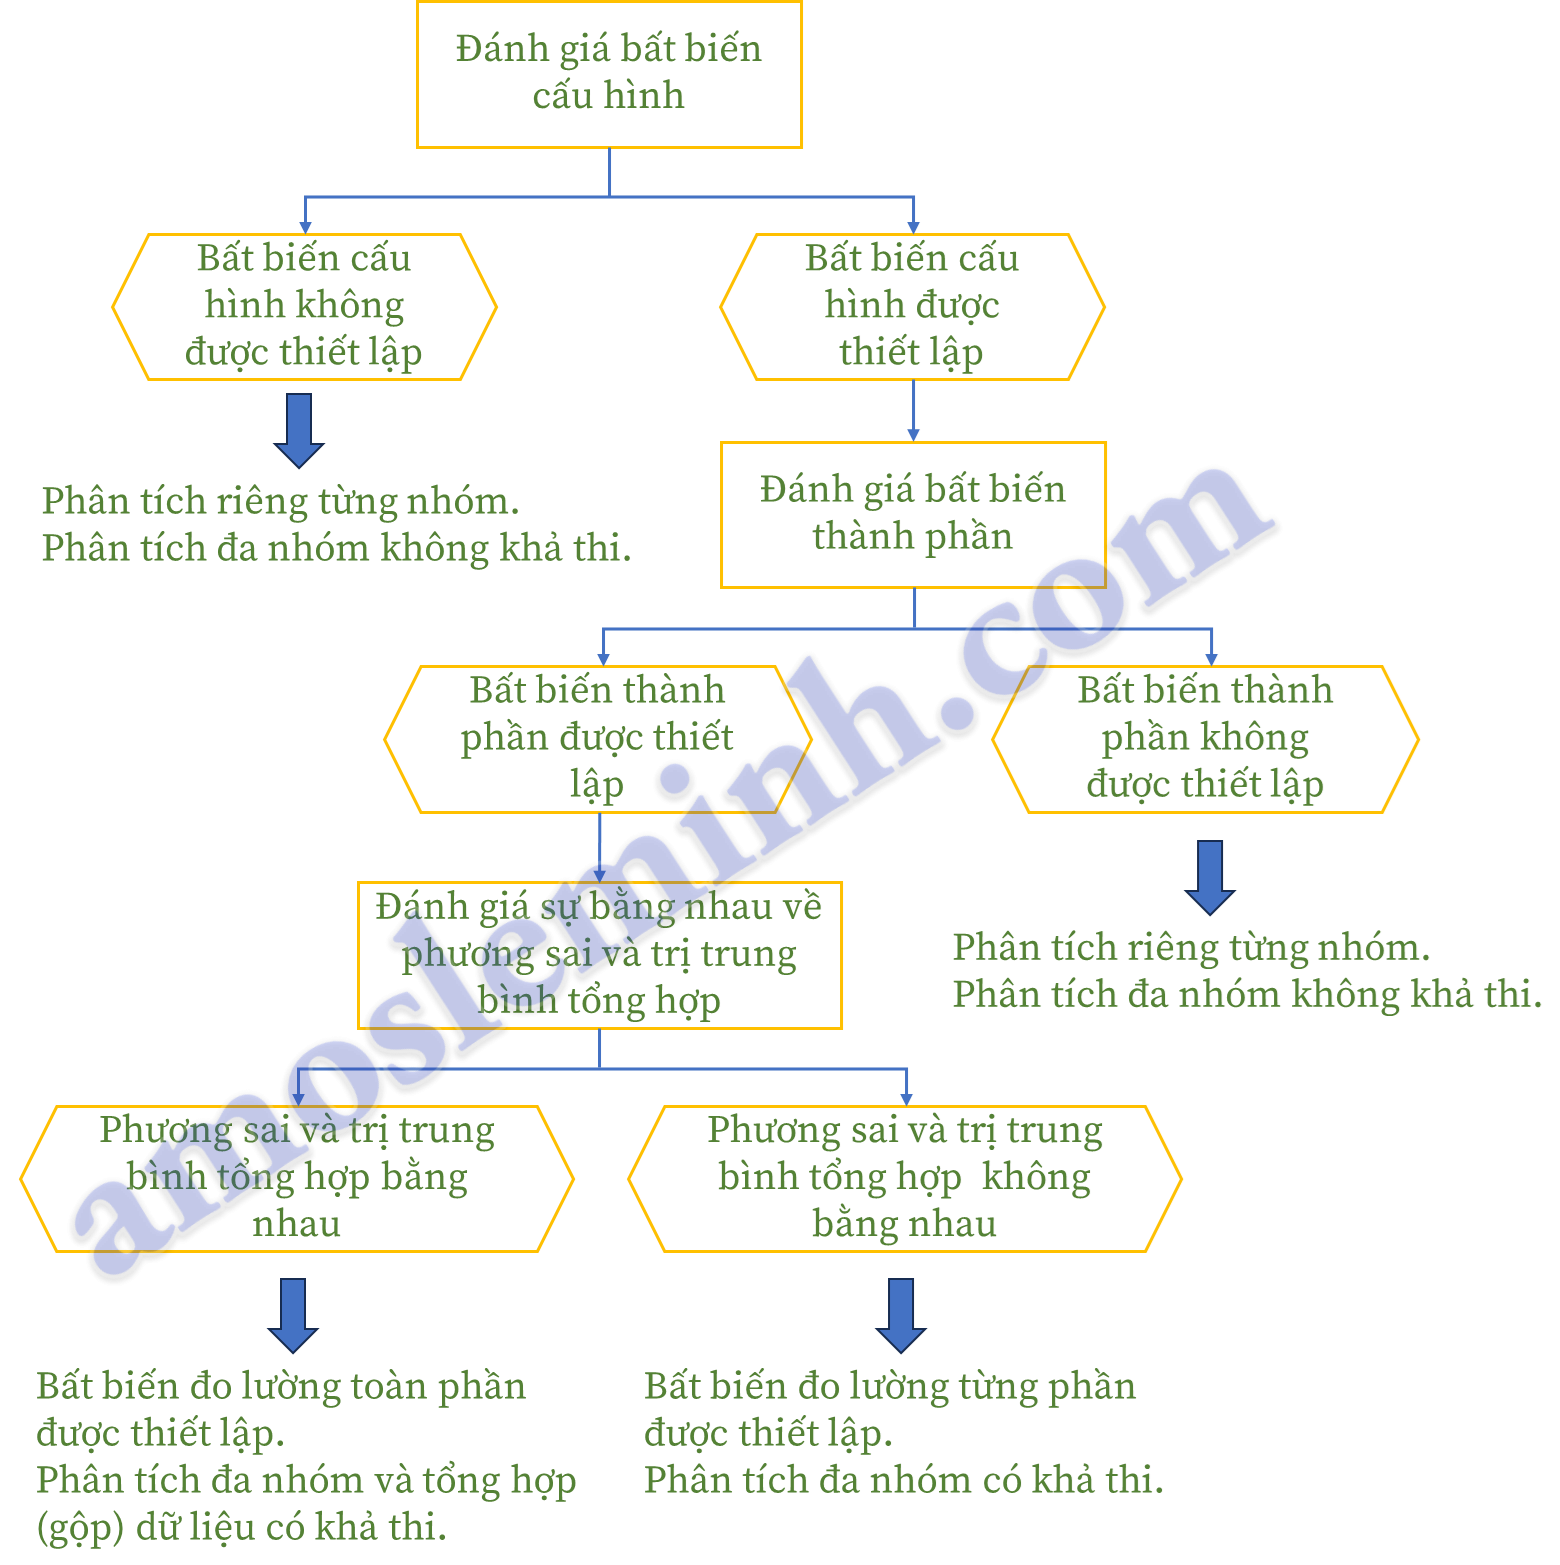
Source: Hair et al (2017)
Another expression of the MICOM process is cited from the source Vu Huu Thanh & Nguyen Minh Ha (2023). This flow chart is generally easy to understand, but if the reader does not have specialized knowledge, it will be difficult to understand. We recommend that you read the book Advanced PLS SEM Analysis by Prof. Nguyen Minh Ha and Dr. Edited by Vu Huu Thanh of Ho Chi Minh City Open University, we evaluate this set of books (including 2 basic and advanced books) as quite methodical and useful for those who need to analyze and deeply understand PLS SEM running with SmartPLS. . The only downside of this set of books is that they are practiced on SmartPLS 3, not SmartPLS 4. However, in our opinion, this is not too important because the nature of the two versions is only different in the interface. (We currently do not have the conditions to test the algorithm).
Figure 2 – MICOM procedure presented according to Cheah et al (2020)
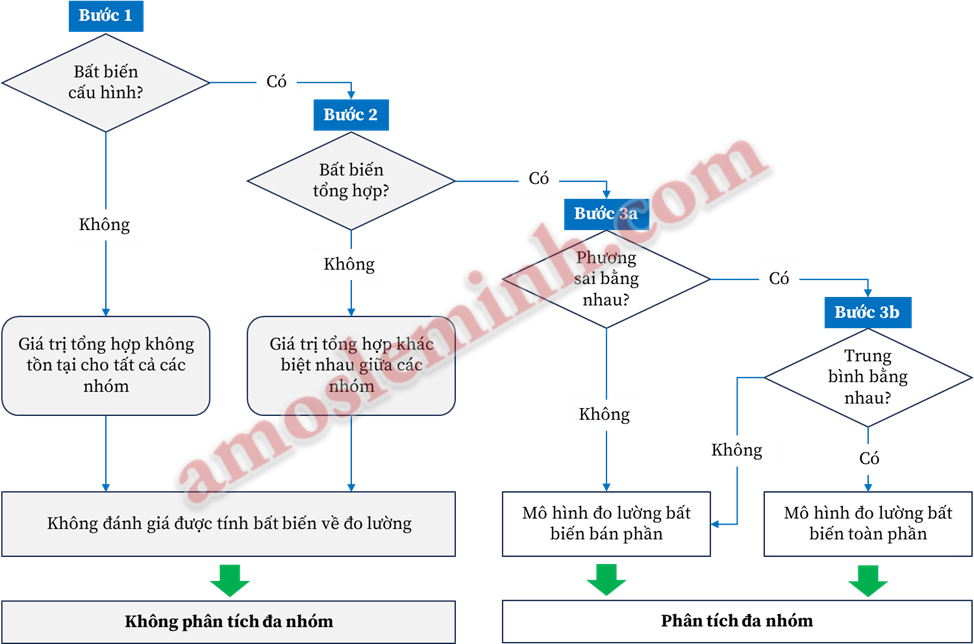
Source: Vu Huu Thanh & Nguyen Minh Ha (2023)
Thus, we can see that the MICOM procedure is a prerequisite procedure before running MGA for the PLS SEM model. Currently, many people still do not understand the nature of the problem, so when analyzing MGA, they simply run the MGA procedure without going through the MICOM process as we mentioned above. This is not standard and will lead to discrepancies in results if the MICOM procedure is not satisfactory with the study data set. Partly because MICOM procedures are relatively complicated and quite new to domestic researchers. Because SmartPLS running PLS SEM is relatively new in Vietnam, only appearing in research in the past few years, so there are not many reference documents and research projects.
Now, we will present the checking steps of the MICOM procedure. In this topic, we do not present in-depth the nature of the problem, we only focus on helping readers solve the story of MICOM analysis practice and read the results for the MGA problem for the PLS SEM model. runs on the SmartPLS 4 platform. Readers who need in-depth research should read the documents we introduced above.
What is configuration invariance? A model is called configuration invariant when it satisfies the following conditions:
- The model does not change. To put it simply, the model is theoretically unchanged between research groups when running MGA. For example, the author’s research model when analyzing data from the male gender group is different from the model when the author collects data from the female group.
- Algorithm settings when running the model between different groups do not change. This means that for each analysis group, you cannot change the algorithm settings when running in SmartPLS.
→ When such conditions are satisfied, it is said that configuration invariance is not established. Otherwise, configuration invariance is established.
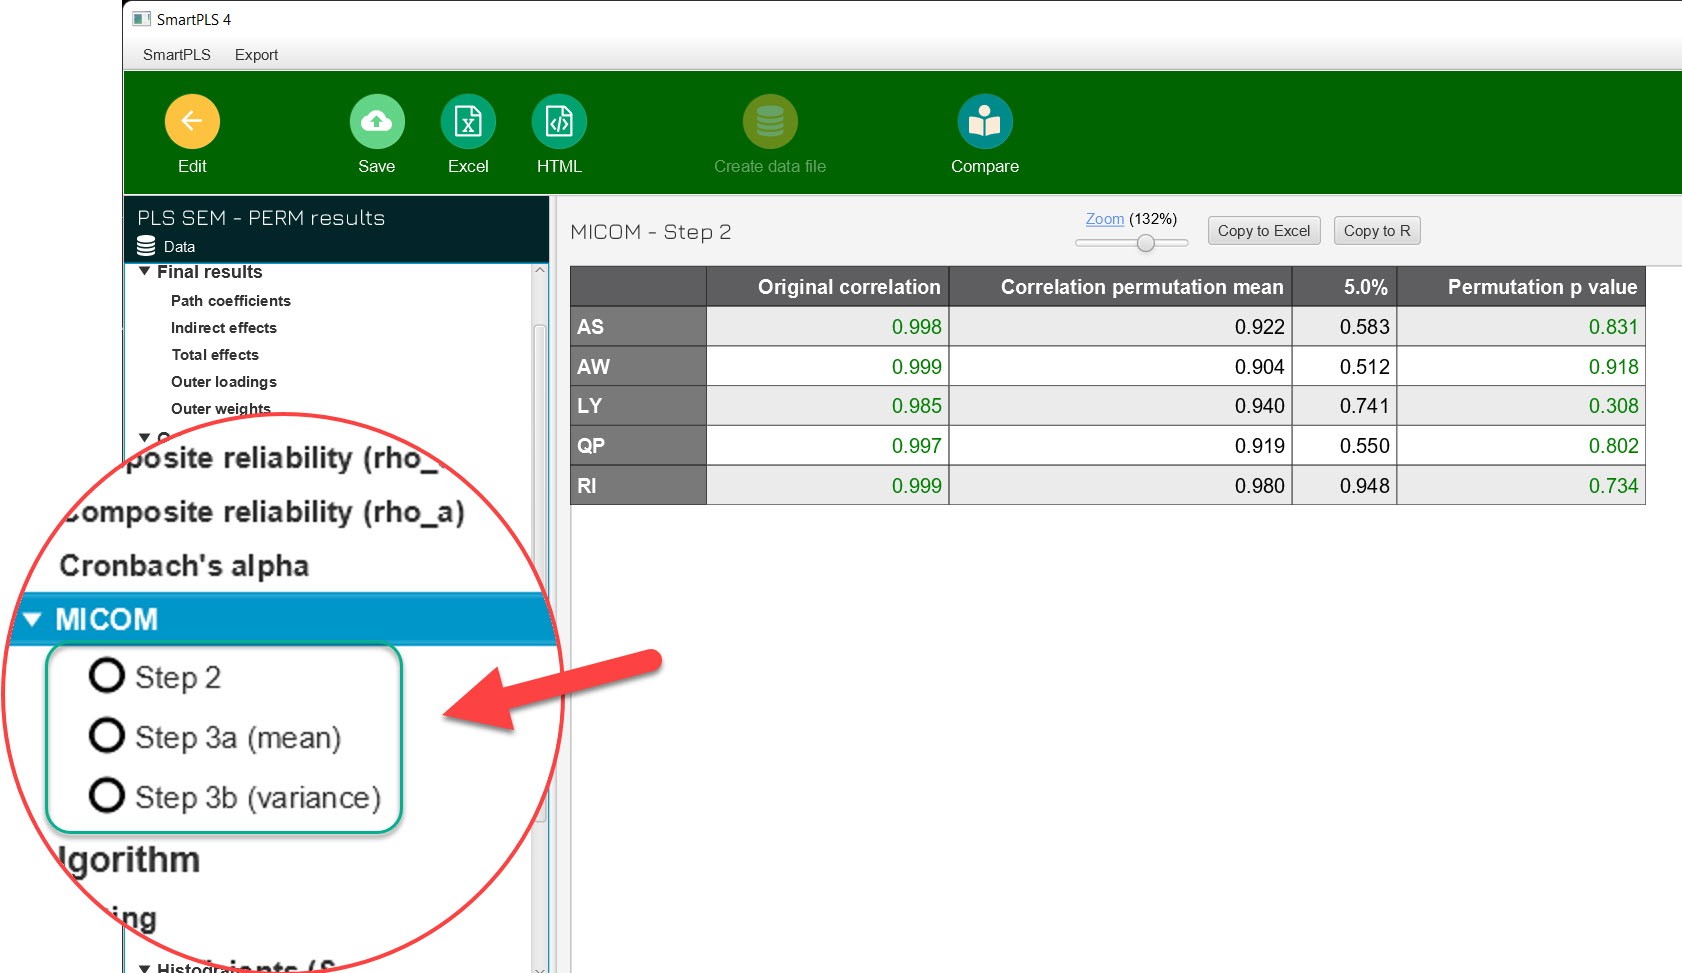
Normally when analyzing a PLS SEM model in SmartPLS, the program will default to the settings, and the user will not change them, so with satisfactory input data, the default research model is understood to be invariant. configuration. So in the MICOM analysis results, SmartPLS only produces results from step 2 and steps 3a, 3b.
Figure 3 – MICOM steps in SmartPLS 4
So step 1 in Figure 2 is almost like we default to invariant configuration. We will check step 2 later.
Step 2: Check synthetic invariance? (Compositional invariance?)
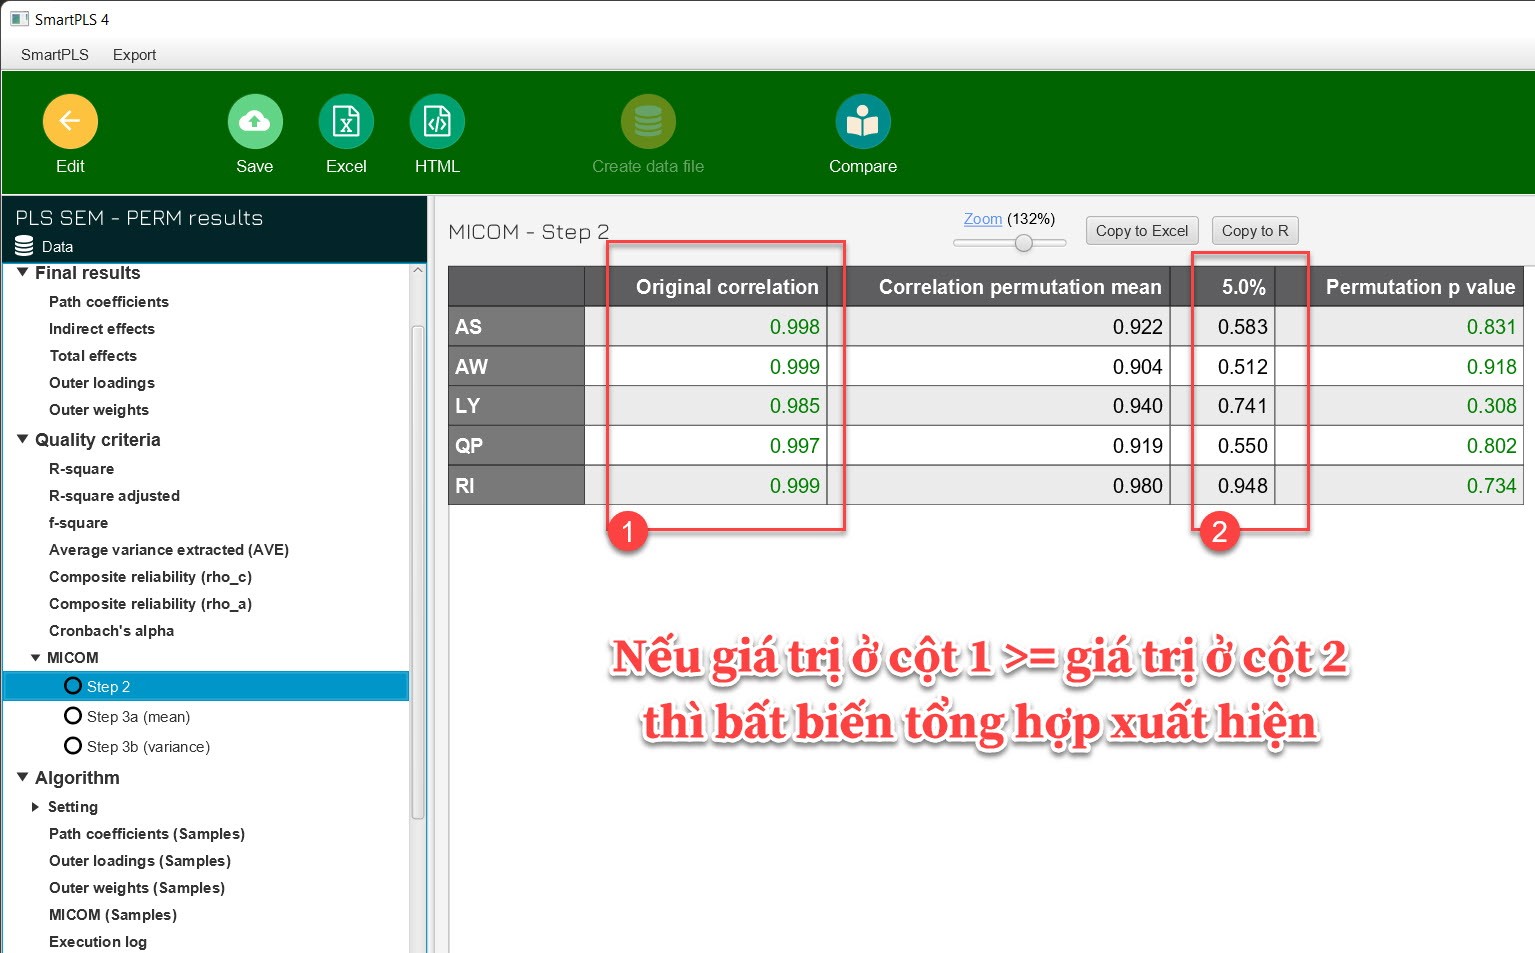
If the Original correlation value is greater than or equal to the value of the 5% threshold then synthetic invariance is established, otherwise it is not. If synthetic invariance is established, go to step 3a. At the end of step 2, we can conclude that MGA analysis is feasible.
Step 3a: Check for equal variances?
If the value in column 1 is within the 2.5% to 97.5% threshold, it can be concluded that the variances are equal (meaning the average difference in variance between the two groups of men and women is insignificant, we also have can be evaluated by p value quickly) → Continue to check step 3b (test for equal average?). If the variances are not equal, that is, the value in column 1 is not within the 2.5% to 97.5% threshold, → Partial invariance measurement model → cannot combine data of groups to run estimates. SEM, we can just run MGA and evaluate the regression estimates for each group separately.
Step 3b: Check for equal means?
If the value in column 1 is within the 2.5% to 97.5% threshold, the average conclusion is equal → full invariance measurement model → data can be pooled to run an overall regression estimate. for the dataset. On the contrary → partial invariance measurement model → data cannot be pooled.
At this point, readers will wonder, at the end of step 2, the conclusion that the MGA analysis is meaningful, so what is the point of performing steps 3a and 3b? According to Henseler et al. (2016) cited by Vu Huu Thanh and Nguyen Minh Ha (2023), if the measurement model is considered to be semi-invariant, data from each group should not be accumulated to estimate the model. SEM, which data should be separated into groups for analysis and estimation. That means you need to analyze and estimate the SEM model in separate groups, not combine them into one data set.
II. MULTI-GROUP ANALYSIS (MGA)
After the MICOM process is carried out, the results show that the MGA analysis is meaningful, we will proceed with the MGA analysis.
Currently, SmartPLS provides the PLS-MGA multigroup test that only compares a maximum of 2 groups. With multi-group analyzes of 3 or more groups, it is required that we perform pairwise comparisons.
In this topic, we will guide you through the MGA procedure running on SmartPLS version 4.0.9.2.
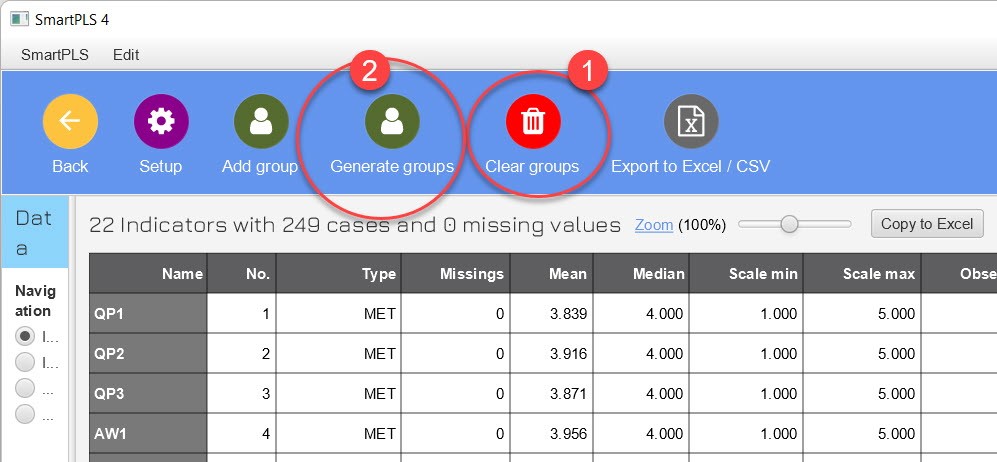
The first step, double click on the data set to perform grouping.
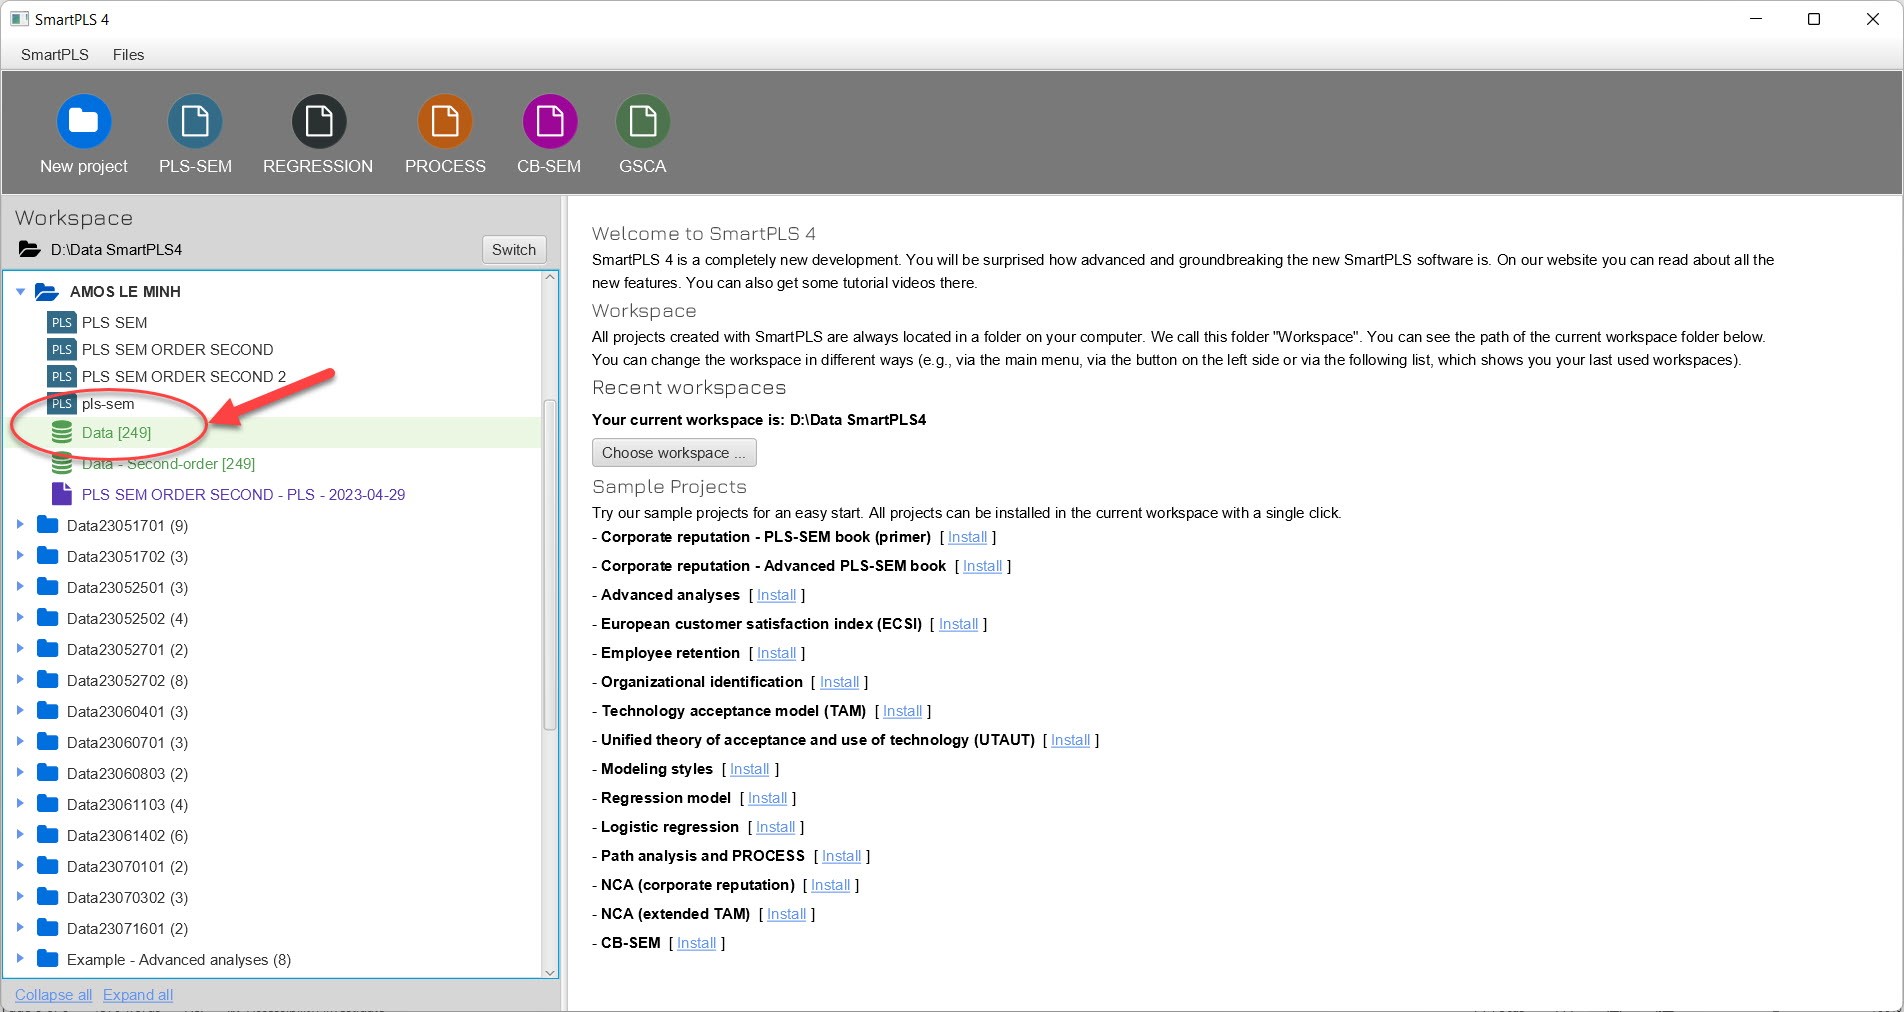
To make sure no groups have been created before, click the Clear groups button to delete all previously created groups, to avoid confusion while running. Then, you choose Generate groups (choose Add group, you have to do it manually, choose this so the program can group groups quickly).
Chúng ta chọn giới tính để phân tích.
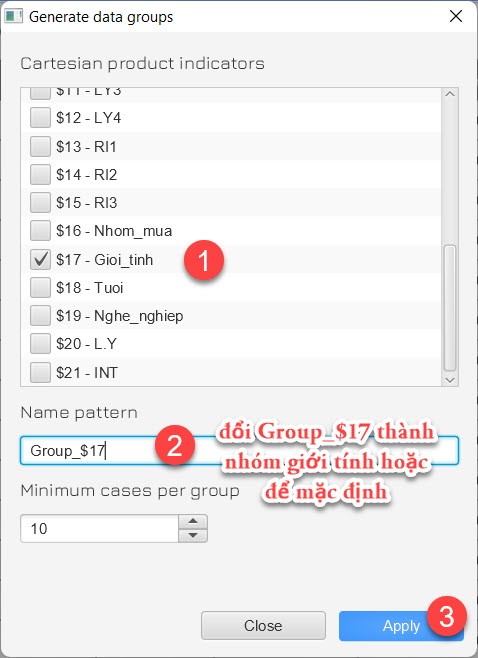
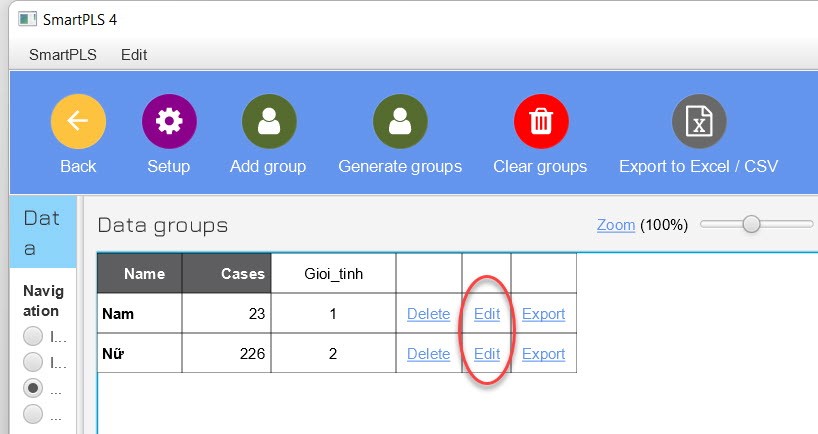
After clicking Apply, click Edit to change the group name to Men and Women (can be written in Vietnamese).
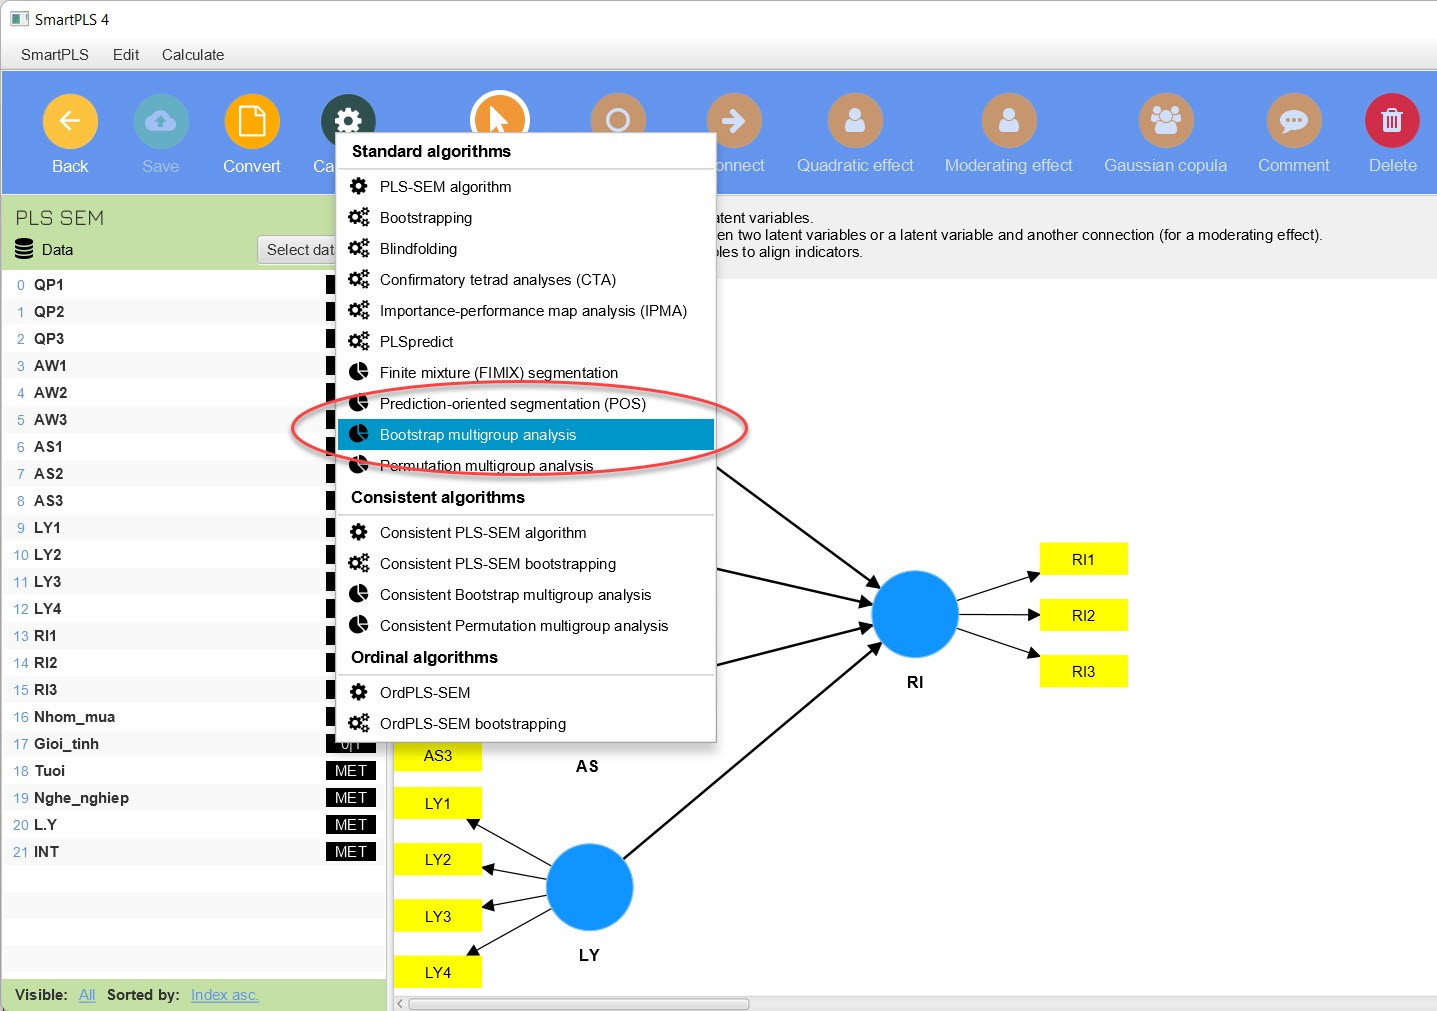
Once done, we press the Back button to return to the main screen, and select the model to analyze. At this point you can proceed with the MICOM procedure as described above. Ok, just switched to MGA. To perform MGA, you choose Bootstrap multigroup analysis.
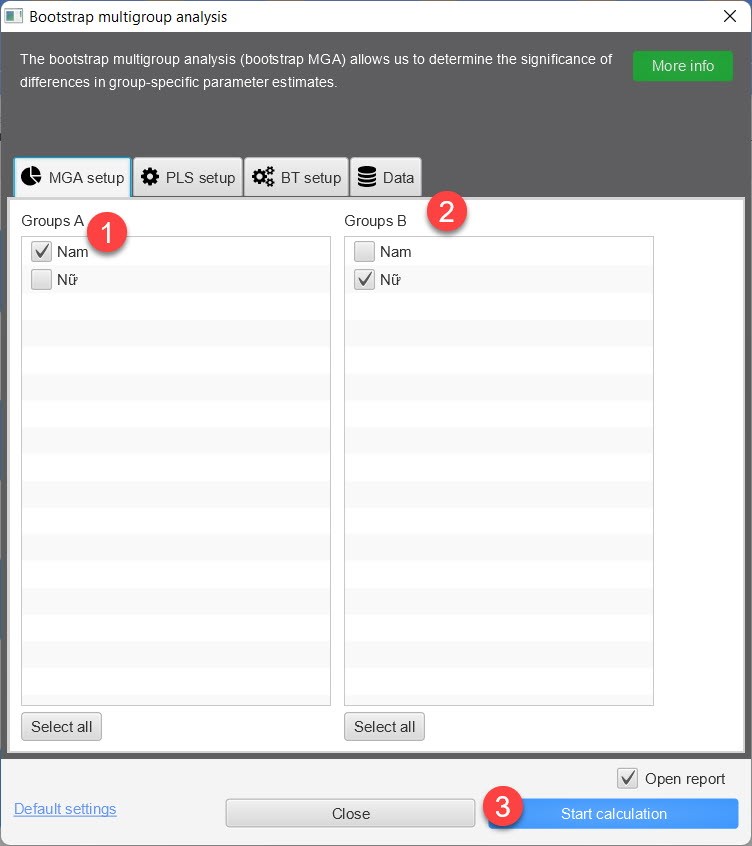
Here the program will have 2 groups A and B, you choose group A as male and group B as female (can be vice versa). Leave other settings as default as OK.
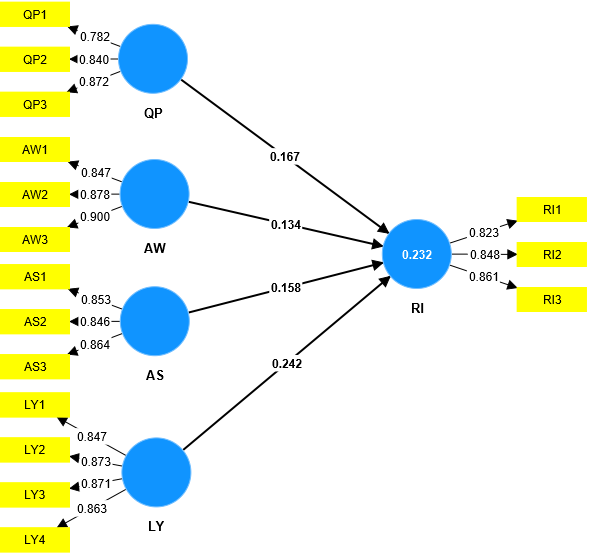
Path analysis results for the Male group

Path analysis results for the Female group
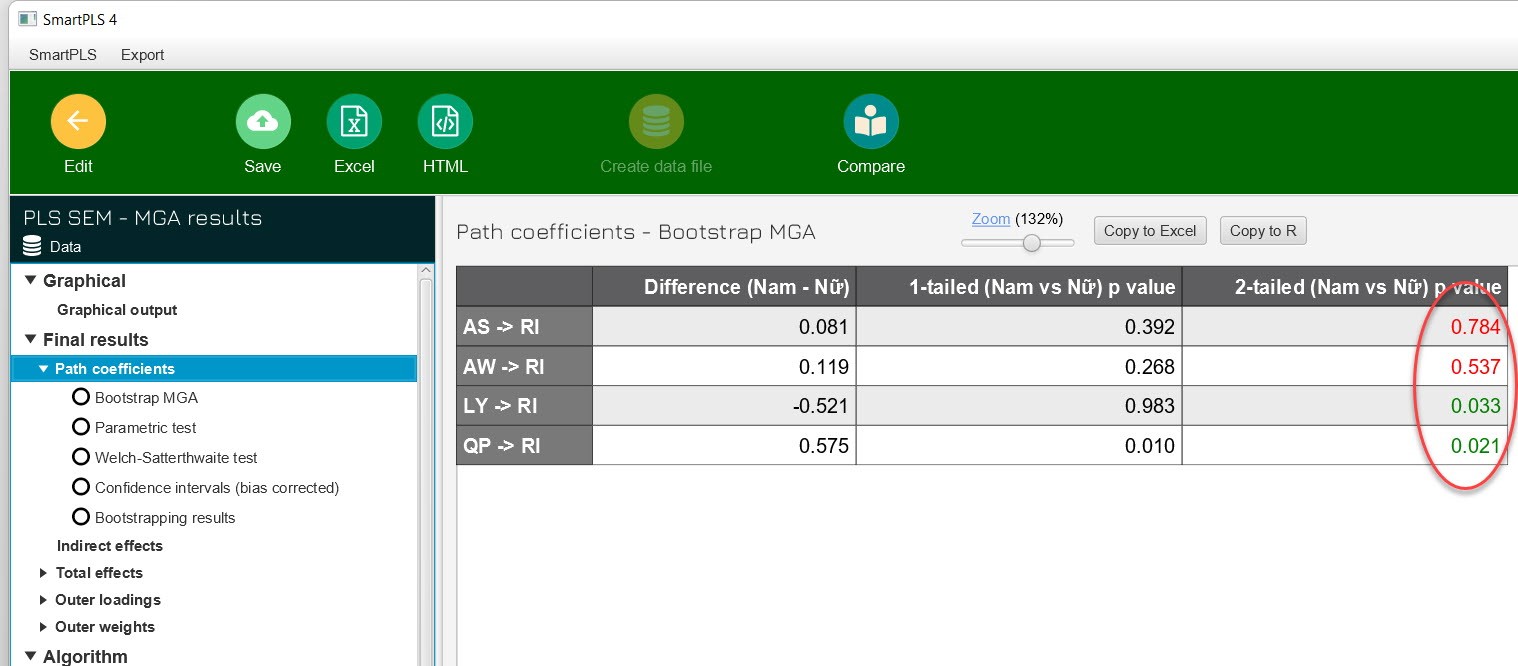
Reading the results, select the path coefficient. We will see that, here paying attention to the P-value (2-tailed) column, the differences between groups are only statistically significant for the relationships LY → RI and QP → RI, and AS → RI and AW → RI is not statistically significant. Having statistical significance means that there will be a difference between the Male group and the Female group, and vice versa.
Now to evaluate the path coefficients of each group in detail, go to the bootstrap analysis results.
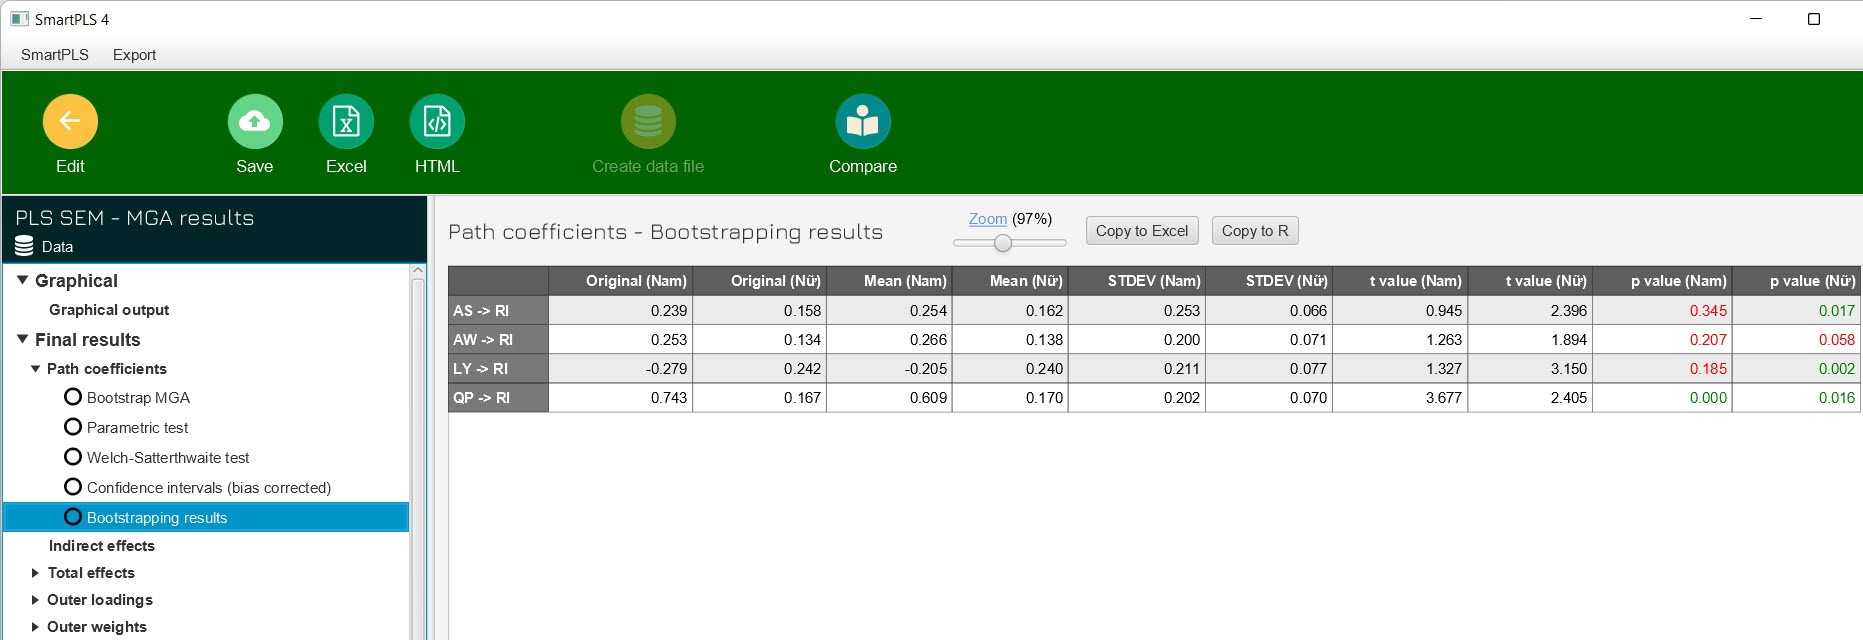
We should use the results from the original data, because if you use the results from the bootstrap data, it will be different after each run if the bootstrap data is generated with a different number of samples each time. . But if you fix the default number of bootstrap samples for SmartPLS 4.0.9.2 version to 5000, the results will be the same across runs.
At this point, you give recommended solutions for businesses. If the selected improvement factor belongs to LY or QP, you need to consider the gender factor Male and Female.
At this point, the MGA process is completed. In case there are 3 groups, we need to perform pairwise comparisons (A vs B; B vs C; C vs A). If there are 4 or more groups, do the same as with 3 groups (The number of pairs to compare is Convolution 2 of 4 → C24 = 4!/(2!(4-2)!) = 6 pairs. Convolution combination k of n elements is Ckn = n!/(k!(n-k)!)). Or we can perform an Omnibus (OTG) test of group differences (Hair et al., 2017).
References:
Cheah, J.-H., Thurasamy, R., Memon, M. A., Chuah, F., & Ting, H. (2020). Multigroup analysis using SmartPLS: Step-by-step guidelines for business research. Asian Journal of Business Research, 10(3), I–XIX.
Hair Jr, J. F., Sarstedt, M., Ringle, C. M., & Gudergan, S. P. (2017). Advanced issues in partial least squares structural equation modeling. saGe publications.
Henseler, J., Ringle, C. M., & Sarstedt, M. (2016). Testing measurement invariance of composites using partial least squares. International Marketing Review, 33(3), 405–431. https://doi.org/10.1108/IMR-09-2014-0304
Steenkamp, J.-B. E. M., & Baumgartner, H. (1998). Assessing measurement invariance in cross-national consumer research. Journal of Consumer Research, 25(1), 78–90.
Vandenberg, R. J., & Lance, C. E. (2000). A review and synthesis of the measurement invariance literature: Suggestions, practices, and recommendations for organizational research. Organizational Research Methods, 3(1), 4–70.
Vu Huu Thanh, & Nguyen Minh Ha. (2023). Data analysis textbook applying the PLS – SEM model (1st ed.). Ho Chi Minh City National University Publishing House.